


On December 18, 2025—the 47th anniversary of China’s historic “Reform and Opening-Up” policy—Hainan Province officially launched island-wide customs closure operations, marking what Chinese officials describe as “the most significant institutional opening in China’s post-reform era.” The scale is unprecedented: 39,000 square kilometers (54 times larger than Singapore, 10 times larger than Dubai) transformed into the world’s largest free trade port by area.
The numbers tell a compelling story. Zero-tariff coverage expanded from 21% to 74% overnight, encompassing 6,637 product categories. Yangpu Port, Hainan’s flagship logistics hub, reached 3 million TEUs in 2025—representing 300% growth in just three years. Perhaps most striking: documented cases show Indonesian cargo saving 32% in costs by rerouting from Singapore to Hainan, according to analysis by ARC Group.
But does this represent an existential threat to Singapore’s 200-year dominance of Asia-Pacific trade? Will Dubai’s role as the gateway to 2 billion people be undermined? Or are we witnessing something more nuanced—the emergence of complementary, specialized hubs serving distinct market segments?
This analysis moves beyond headline comparisons to examine institutional frameworks, infrastructure capabilities, and direct competition zones. Understanding this shift requires analyzing not just tariff policies, but the strategic logic of three fundamentally different business models operating in an increasingly multipolar trade landscape.
What you’ll learn in this comprehensive guide:
- Side-by-side comparison of institutional frameworks, tax structures, and infrastructure capacity
- Strategic logic behind each hub’s competitive advantages
- Data-backed analysis of where they compete directly and where they complement each other
- Port infrastructure deep-dive with throughput projections to 2035
- Real-world cost and time comparisons for key trade routes
- Decision framework for businesses evaluating hub strategies
Analysis based on official port authority data, customs statistics, and on-ground reporting from December 2025-January 2026.
Understanding the Three Models—Institutional Frameworks
To understand how Hainan fits into the existing free trade port hierarchy, we must first map the fundamental differences in institutional design. The following comparison synthesizes data from Hainan Provincial Government, Maritime and Port Authority of Singapore, Dubai Multi Commodities Centre, and World Bank Doing Business indicators.
| Category | Hainan FTP 🇨🇳 | Singapore 🇸🇬 | Dubai (JAFZA) 🇦🇪 |
|---|---|---|---|
| FOUNDATIONAL METRICS | |||
| Total Area | 39,000 km² | 734 km² | ~4,000 km² (154 free zones total) |
| Operational Status | Full closure: Dec 18, 2025 | Continuous since 1819 | JAFZA: 1985 / ecosystem mature |
| Strategic Model | China market access gateway | Global neutral transshipment | EMEA-Asia connector |
| Legal Framework | Hainan FTP Law (2021) + Customs Announcements 158-159 | Free Trade Zones Act / Customs Act | UAE Free Zone regulations |
| TRADE POLICY ARCHITECTURE | |||
| Tariff Exemption Scope | 74% of HS codes (6,637 categories) | 100% for re-export goods | 100% for free zone operations |
| Key Innovation | 30% value-added rule (mainland access) | Entrepôt trade model (no transformation required) | Complete customs isolation |
| Import Duties Waived | Tariff + VAT + consumption tax | All duties on transit/transshipment | All duties within free zones |
| Negative List Items | 2,323 HS codes (agriculture, textiles, vehicles) | None (universal free trade) | None for free zone boundaries |
| INFRASTRUCTURE CAPACITY | |||
| Container Throughput (2025) | 3.0M TEU (Yangpu Port) | 41.12M TEU (all terminals) | 14.1M TEU (Jebel Ali) |
| Annual Growth Rate (3-yr CAGR) | 88% (2022-2025) | 4.2% | 3.8% |
| 2035 Target | 12M TEU + 225M tons total cargo | Maintain 40M+ TEU | 25M TEU target |
| Automated Operations | 25 containers/hr crane capacity | Fully automated terminals | Semi-automated, expanding |
| Shipping Connectivity | 59 international routes (33 foreign) | 600+ ports globally, 200+ countries | 180+ shipping lines, 140+ ports |
| TAX ENVIRONMENT | |||
| Corporate Income Tax | 15% (encouraged industries only) | 17% (standard rate, one-tier) | 0% (15-50 years depending on zone) |
| Personal Income Tax | 15% cap (qualified high-end talent) | Progressive 0-22% | 0% |
| Value-Added Tax | Mainland: 13% / Hainan exemptions | 9% GST (standard) | 5% VAT (free zones exempt) |
| Withholding Tax (dividends) | 10% (standard) / reduced by treaty | 0% (one-tier system) | 0% |
| OPERATIONAL ENVIRONMENT | |||
| Customs Clearance Speed | E-declaration: <1 hour target | Average 10 minutes (automated) | 24-48 hours (standard) |
| Storage Limitations | None (indefinite bonded storage) | None for FTZ goods | None within free zones |
| Foreign Ownership | 100% (most sectors) / restricted list | 100% (most sectors) | 100% (within free zones) |
| Currency Controls | EF account system (managed) | None (full convertibility) | None (full convertibility) |
| ACCESS & CONNECTIVITY | |||
| Visa-Free Countries | 86 (up to 30 days) | 163 | 90+ (visa-on-arrival) |
| International Airport | Haikou Meilan (18M pax/yr) | Changi (62M pax/yr)—world’s best | Dubai International (87M pax/yr) |
| Flight Connectivity | 120+ international routes | 400+ cities, 100+ countries | 260+ destinations, 95+ countries |
| FINANCIAL ECOSYSTEM | |||
| Banking Infrastructure | Developing offshore RMB center | 3rd largest forex center ($640B daily) | Regional Islamic finance hub |
| Stock Exchange Access | Shanghai/Shenzhen connects | SGX ($600B+ market cap) | DFM/ADX ($800B+ combined) |
| Insurance Services | Basic coverage available | Global marine insurance hub | Regional property/casualty hub |
| LEGAL & GOVERNANCE | |||
| Legal System | Civil law (Chinese socialist) | English common law | Civil law + DIFC common law |
| Corruption Index (2025) | China: 42/100 (76th rank) | 83/100 (5th rank)—very clean | 71/100 (24th rank) |
| Contract Enforcement | 485 days average (China) | 164 days average | 545 days average (UAE) |
| IP Protection Ranking | Moderate (improving) | Very strong (2nd globally) | Moderate (DIFC strong) |
| Arbitration | Hainan International Arbitration Court | SIAC (top 5 globally) | DIAC + DIFC Courts |
Sources: Hainan Provincial Government (2025), Maritime and Port Authority of Singapore (2024), Dubai Multi Commodities Centre (2024), World Bank Doing Business, Transparency International
This comparison reveals a fundamental truth: these are not directly substitutable models. Each hub has constructed a distinct value proposition optimized for specific trade flows, customer segments, and strategic objectives. Understanding these differences is crucial for businesses evaluating where to position their operations.
Singapore's Model: The Trusted Intermediary
Core Value Proposition: “We don’t compete on cost—we compete on trust, efficiency, and network effects.”
Singapore’s dominance of Asia-Pacific trade for two centuries rests on foundations that cannot be easily replicated. As Channel News Asia analysis notes, Singapore’s transformation from a British colonial trading post in 1819 to the world’s second-largest container port by 2024 represents “an accumulation of institutional capital that competing hubs must reckon with.”
Key Strengths:
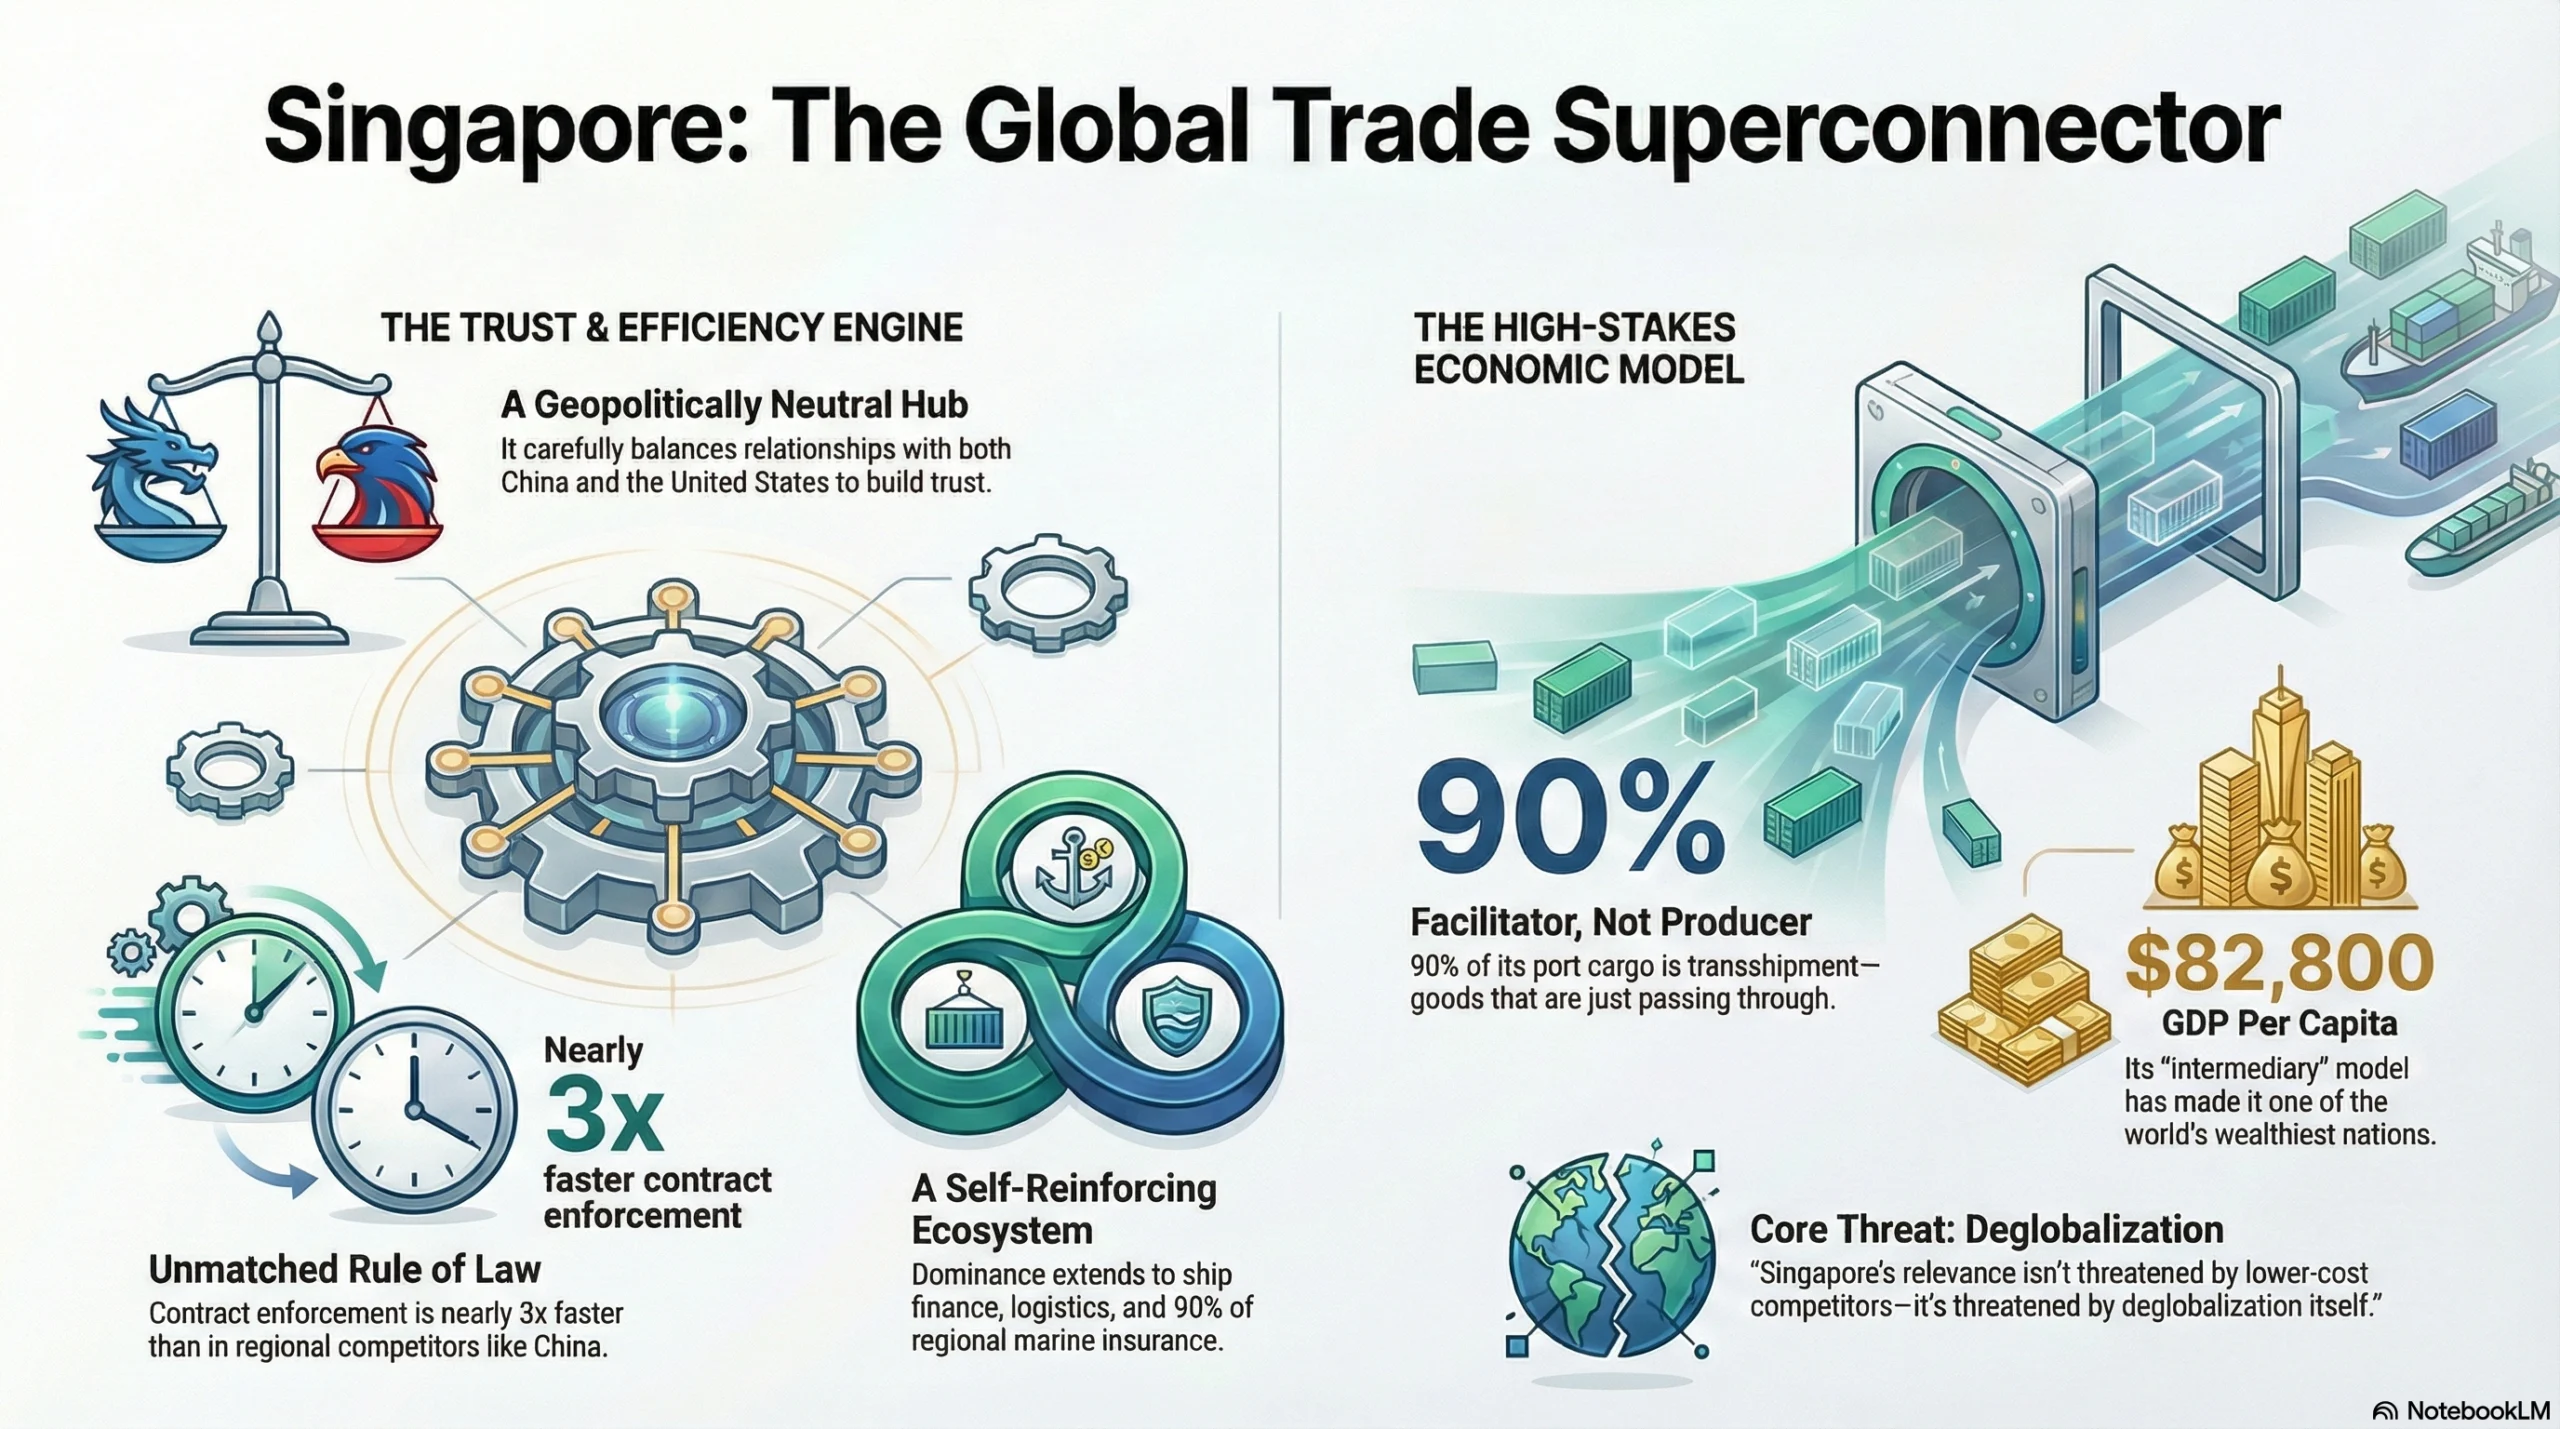
Neutral Jurisdiction: Singapore positions itself as geopolitically neutral territory where Western and Eastern businesses can meet on common ground. While pragmatically China-friendly (75% of trade is China-linked), Singapore maintains security partnerships with the United States and enforces international sanctions. This delicate balance creates trust across diverse stakeholders. As Singapore’s Trade Minister Gan Kim Yong stated in December 2025: “Our value isn’t just geography—it’s trust, efficiency, and neutrality.”
Rule of Law: Singapore ranks 2nd globally in rule of law, with contract enforcement averaging 164 days compared to 485 days in China. This predictability is particularly valuable for high-value cargo and complex international transactions. IP protection—critical for technology and pharmaceutical companies—is stronger in Singapore than anywhere else in Asia.
Network Effects: Two hundred years of operation have created deep network effects. Over 600 shipping lines call at Singapore, connecting to 200+ countries. The ecosystem extends beyond the port: ship financing, marine insurance (90% of Asia-Pacific shipping insured via Singapore), commodity trading (40% of global derivatives), and arbitration services create a self-reinforcing cycle. New entrants cannot easily replicate these interlocking relationships.
Service Depth: Singapore’s maritime cluster employs 170,000 people and generates $90 billion annually (5% of GDP). Services extend from ship repair (50+ facilities, the most in Asia) to bunker fuel (world’s largest bunkering port at 50 million tons annually) to maritime technology and logistics software development.
Economic Model:
Singapore generates value from facilitating rather than producing. Approximately 90% of port throughput is transshipment—cargo neither originates nor terminates in Singapore. The island captures margins from transshipment fees, financial services (trade finance, insurance), and logistics management rather than manufacturing. This model proved incredibly profitable: Singapore’s GDP per capita reached $82,800 in 2024, making it one of the world’s wealthiest nations.
Vulnerability:
This strength is also a weakness. Singapore’s dependence on global trade volumes makes it exposed to deglobalization trends. If protectionism reduces international trade by 20%, Singapore’s port throughput could decline proportionally, with cascading effects on the broader economy. As one maritime economics professor noted: “Singapore’s relevance isn’t threatened by lower-cost competitors—it’s threatened by deglobalization itself.”
Additionally, Singapore’s high cost structure ($82,800 GDP per capita translates to expensive labor and real estate) means it cannot compete on price. The model works only if customers value trust and efficiency enough to pay premium rates.
Dubai's Model: The Geographic Necessity
Core Value Proposition: “We’re not optional for EMEA-Asia trade—we’re the inevitable midpoint.”
Dubai’s rise from a small fishing village to a global trade hub in just 40 years represents perhaps the most dramatic transformation in modern commercial history. Unlike Singapore’s two-century evolution, Dubai leveraged oil wealth to rapidly build world-class infrastructure while positioning itself as the indispensable link between East and West.
Key Strengths:
Geographic Centrality: Dubai sits at the crossroads of three continents. A four-hour flight reaches two-thirds of the world’s population, spanning from London to Singapore, from Moscow to Johannesburg. This “midpoint advantage” is particularly valuable for air cargo and high-value goods requiring rapid distribution across EMEA (Europe, Middle East, Africa) and Asia.
The Jebel Ali Port, operated by DP World, handles 60% of Middle East container traffic and serves as the primary gateway for 1.5 billion people in the surrounding region. For cargo moving between Asian manufacturing centers and European/African consumption markets, Dubai often represents the optimal routing.
Cultural Bridge: Dubai’s success stems partly from cultural positioning. With Arabic as the primary language but English widely spoken, Islamic finance infrastructure alongside conventional banking, and a business culture that respects Middle Eastern norms while accommodating Western practices, Dubai serves as a “neutral ground” for EMEA-Asia commerce.
This positioning has become increasingly valuable as geopolitical tensions rise. Recent reporting by South China Morning Post shows 15,000+ Chinese companies registered in Dubai free zones (40% increase in 2024-2025), using Dubai as an offshore platform to access markets where direct Chinese presence faces resistance.
Zero-Tax Permanence: Dubai offers what neither Singapore nor Hainan can match—complete tax exemption for decades. Free zone companies pay 0% corporate tax, 0% personal income tax, and face no withholding taxes on dividends or repatriation. Unlike policy-dependent incentives that might change, Dubai’s tax structure is guaranteed for 15-50 years depending on the free zone, backed by UAE federal law.
This permanence creates certainty for long-term investment decisions. A multinational establishing a $100 million distribution center knows its tax environment won’t change due to political shifts or fiscal pressures.
Specialization: Dubai has carved niches in specific high-value sectors. The Dubai Gold Souk and DMCC make Dubai the world’s largest physical gold trading hub ($75 billion annually). Diamond trading, petrochemical distribution, and increasingly, digital assets and fintech, cluster in Dubai’s specialized free zones.
Economic Model:
Dubai’s economy rests on re-export trade (goods entering Dubai, repackaged or consolidated, then exported to third countries), which represents approximately 60% of total trade value. This is supplemented by real estate, tourism, and financial services. Importantly, oil revenues—while no longer dominant (less than 5% of Dubai’s GDP)—provide a fiscal buffer that allows aggressive infrastructure investment without immediate return-on-investment pressure.
Vulnerability:
Regional instability poses persistent risks. The Yemen conflict (ongoing since 2014), Iran tensions affecting the Strait of Hormuz, and the Israel-Palestine situation impact business confidence and insurance costs. While Dubai itself remains stable, the neighborhood is volatile.
Additionally, Dubai faces increasing competition from Saudi Arabia’s ambitious NEOM project and other Gulf states investing in free zones. The days of Dubai’s monopoly on MENA trade infrastructure are ending.
Governance concerns—particularly regarding labor rights and press freedom (ranked 145th globally by Reporters Without Borders)—limit appeal to certain Western investors with strict ESG criteria.

Hainan's Model: The Market Access Facilitator
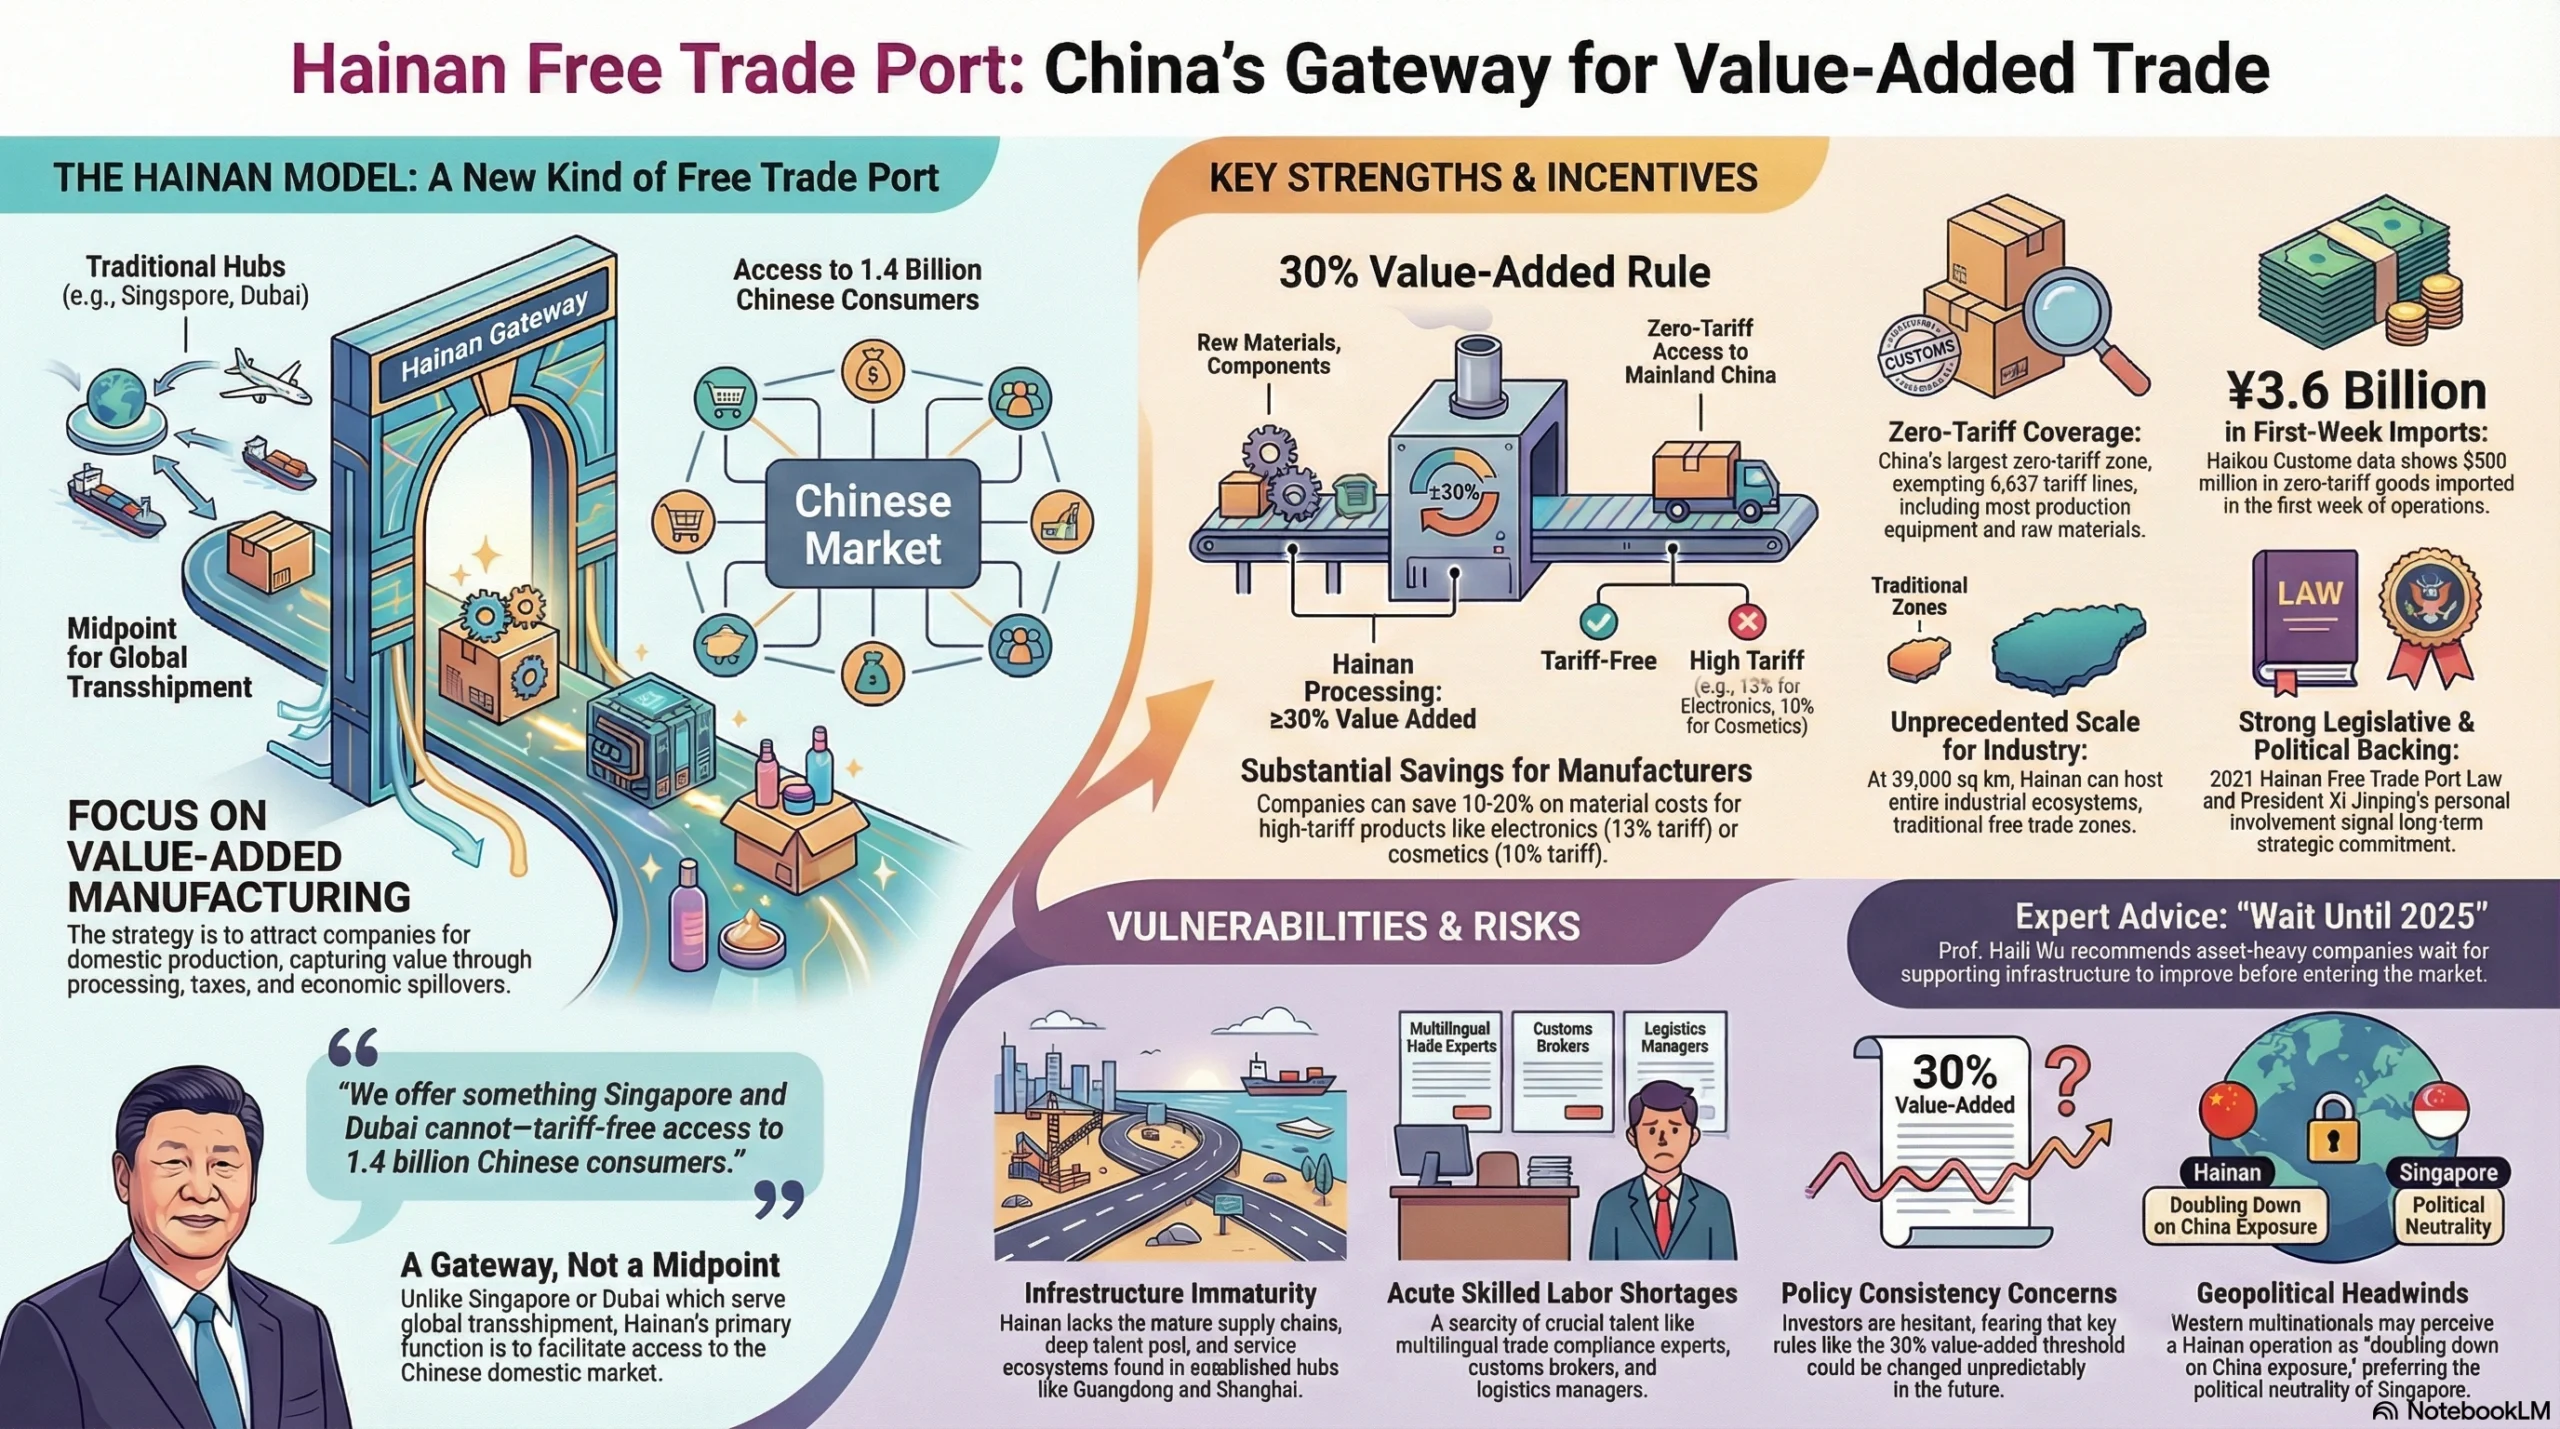
Core Value Proposition: “We offer something Singapore and Dubai cannot—tariff-free access to 1.4 billion Chinese consumers.”
Hainan represents a fundamentally different model. Rather than serving as a neutral intermediary or geographic midpoint, Hainan functions as a gateway specifically designed to facilitate access to the world’s largest consumer market. This specificity is both its greatest strength and inherent limitation.
Key Strengths:
The 30% Value-Added Rule: This policy innovation, detailed in China Briefing’s comprehensive analysis, has no equivalent in Singapore or Dubai. Goods imported to Hainan duty-free can enter mainland China tariff-free if processing adds ≥30% value.
This creates a unique arbitrage opportunity: import high-tariff goods (electronics at 13%, cosmetics at 10%, automotive parts at 8%) to Hainan tax-free, perform value-added processing, then ship to the mainland without paying those duties. The savings for manufacturers are substantial—potentially 10-20% of material costs for high-tariff products.
For example, a pharmaceutical company importing active pharmaceutical ingredients (APIs) from Europe normally faces 6.5% tariffs. By routing through Hainan, formulating the drug in a Hainan facility, and meeting the 30% value-added threshold, the company eliminates this tariff entirely while gaining faster regulatory approval through the Boao Lecheng medical tourism zone.
Zero-Tariff Scale: While Singapore and Dubai offer zero tariffs on all goods (within their free zones), Hainan’s achievement of 74% zero-tariff coverage represents the largest zero-tariff zone in China’s history by both geographic area and product scope. The 6,637 tariff lines exempt from duties include most production equipment, raw materials, and intermediate goods—precisely the inputs manufacturers need.
According to official statistics from Haikou Customs, in the first week of operations alone, zero-tariff imports reached 3.6 billion yuan ($500 million), demonstrating immediate adoption.
Policy Commitment: Unlike ad-hoc incentives that might change with political winds, Hainan’s framework rests on the Hainan Free Trade Port Law passed by China’s National People’s Congress in 2021. This legislative foundation—similar to Hong Kong’s Basic Law—provides legal stability and signals long-term commitment at the highest levels of government. President Xi Jinping’s personal involvement in the December 18 launch ceremony underscored this strategic priority.
Scale Potential: At 39,000 square kilometers, Hainan can accommodate entire industrial ecosystems. Unlike traditional free trade zones limited to a few square kilometers, Hainan can host large-scale manufacturing, agricultural processing, pharmaceutical production, and technology R&D simultaneously. The Yangpu Economic Development Zone alone spans 131 square kilometers—larger than Singapore’s entire Jurong Island petrochemical complex.
Economic Model:
Hainan’s model focuses on value-added manufacturing for the domestic Chinese market rather than international transshipment. The strategy is to attract companies that need to serve Chinese consumers by offering a lower-cost production pathway. Value is captured through processing fees, corporate taxes (15% for encouraged industries), and broader economic spillovers (employment, real estate, services).
Crucially, Hainan’s success doesn’t depend on replacing existing trade flows—it depends on creating new flows that wouldn’t exist without the 30% rule incentive.
Vulnerability:
Infrastructure immaturity is Hainan’s most obvious weakness. As Prof. Haili Wu from Xi’an Jiaotong-Liverpool University notes in China Briefing: “For companies that are asset-heavy and heavily reliant on supporting facilities, it is recommended to wait until the supporting infrastructure significantly improves after the customs closure in 2025 before entering the market.”
Hainan lacks Guangdong’s mature supply chains, Shanghai’s deep talent pool, and Singapore’s service ecosystem. Building these takes years, possibly decades. Skilled labor shortages are particularly acute—multilingual trade compliance experts, customs brokers, and logistics managers are scarce compared to established hubs.
Policy consistency concerns persist despite legislative backing. Foreign investors remember previous special economic zones where rules changed unpredictably. Will the 30% threshold remain stable, or might it be raised to 35% or 40% in future years? Will eligibility criteria tighten? These uncertainties create hesitation.
Geopolitical perception represents perhaps the biggest barrier for Western multinationals. In an era of US-China tensions, establishing significant operations in Hainan is seen as “doubling down on China exposure.” Companies worried about sanctions risk, technology transfer requirements, or data localization mandates may prefer Singapore’s neutrality despite higher costs.
As analysis by the Institute for China-America Studies observed: “Hainan’s success depends not just on policy design, but on whether global businesses trust those policies will remain stable and whether geopolitical risks remain manageable.”
Infrastructure Deep-Dive—Capacity and Capability Analysis
Policy frameworks matter, but operational capacity determines what’s actually possible. Let’s examine the physical infrastructure that underpins each hub’s competitive position.
Yangpu Port (Hainan)—The Rapid Riser
Historical Growth Trajectory:
The transformation of Yangpu Port from a minor regional facility to a significant international hub represents one of the most dramatic infrastructure success stories in recent Chinese development. According to data compiled from Yangpu Port Authority annual reports:
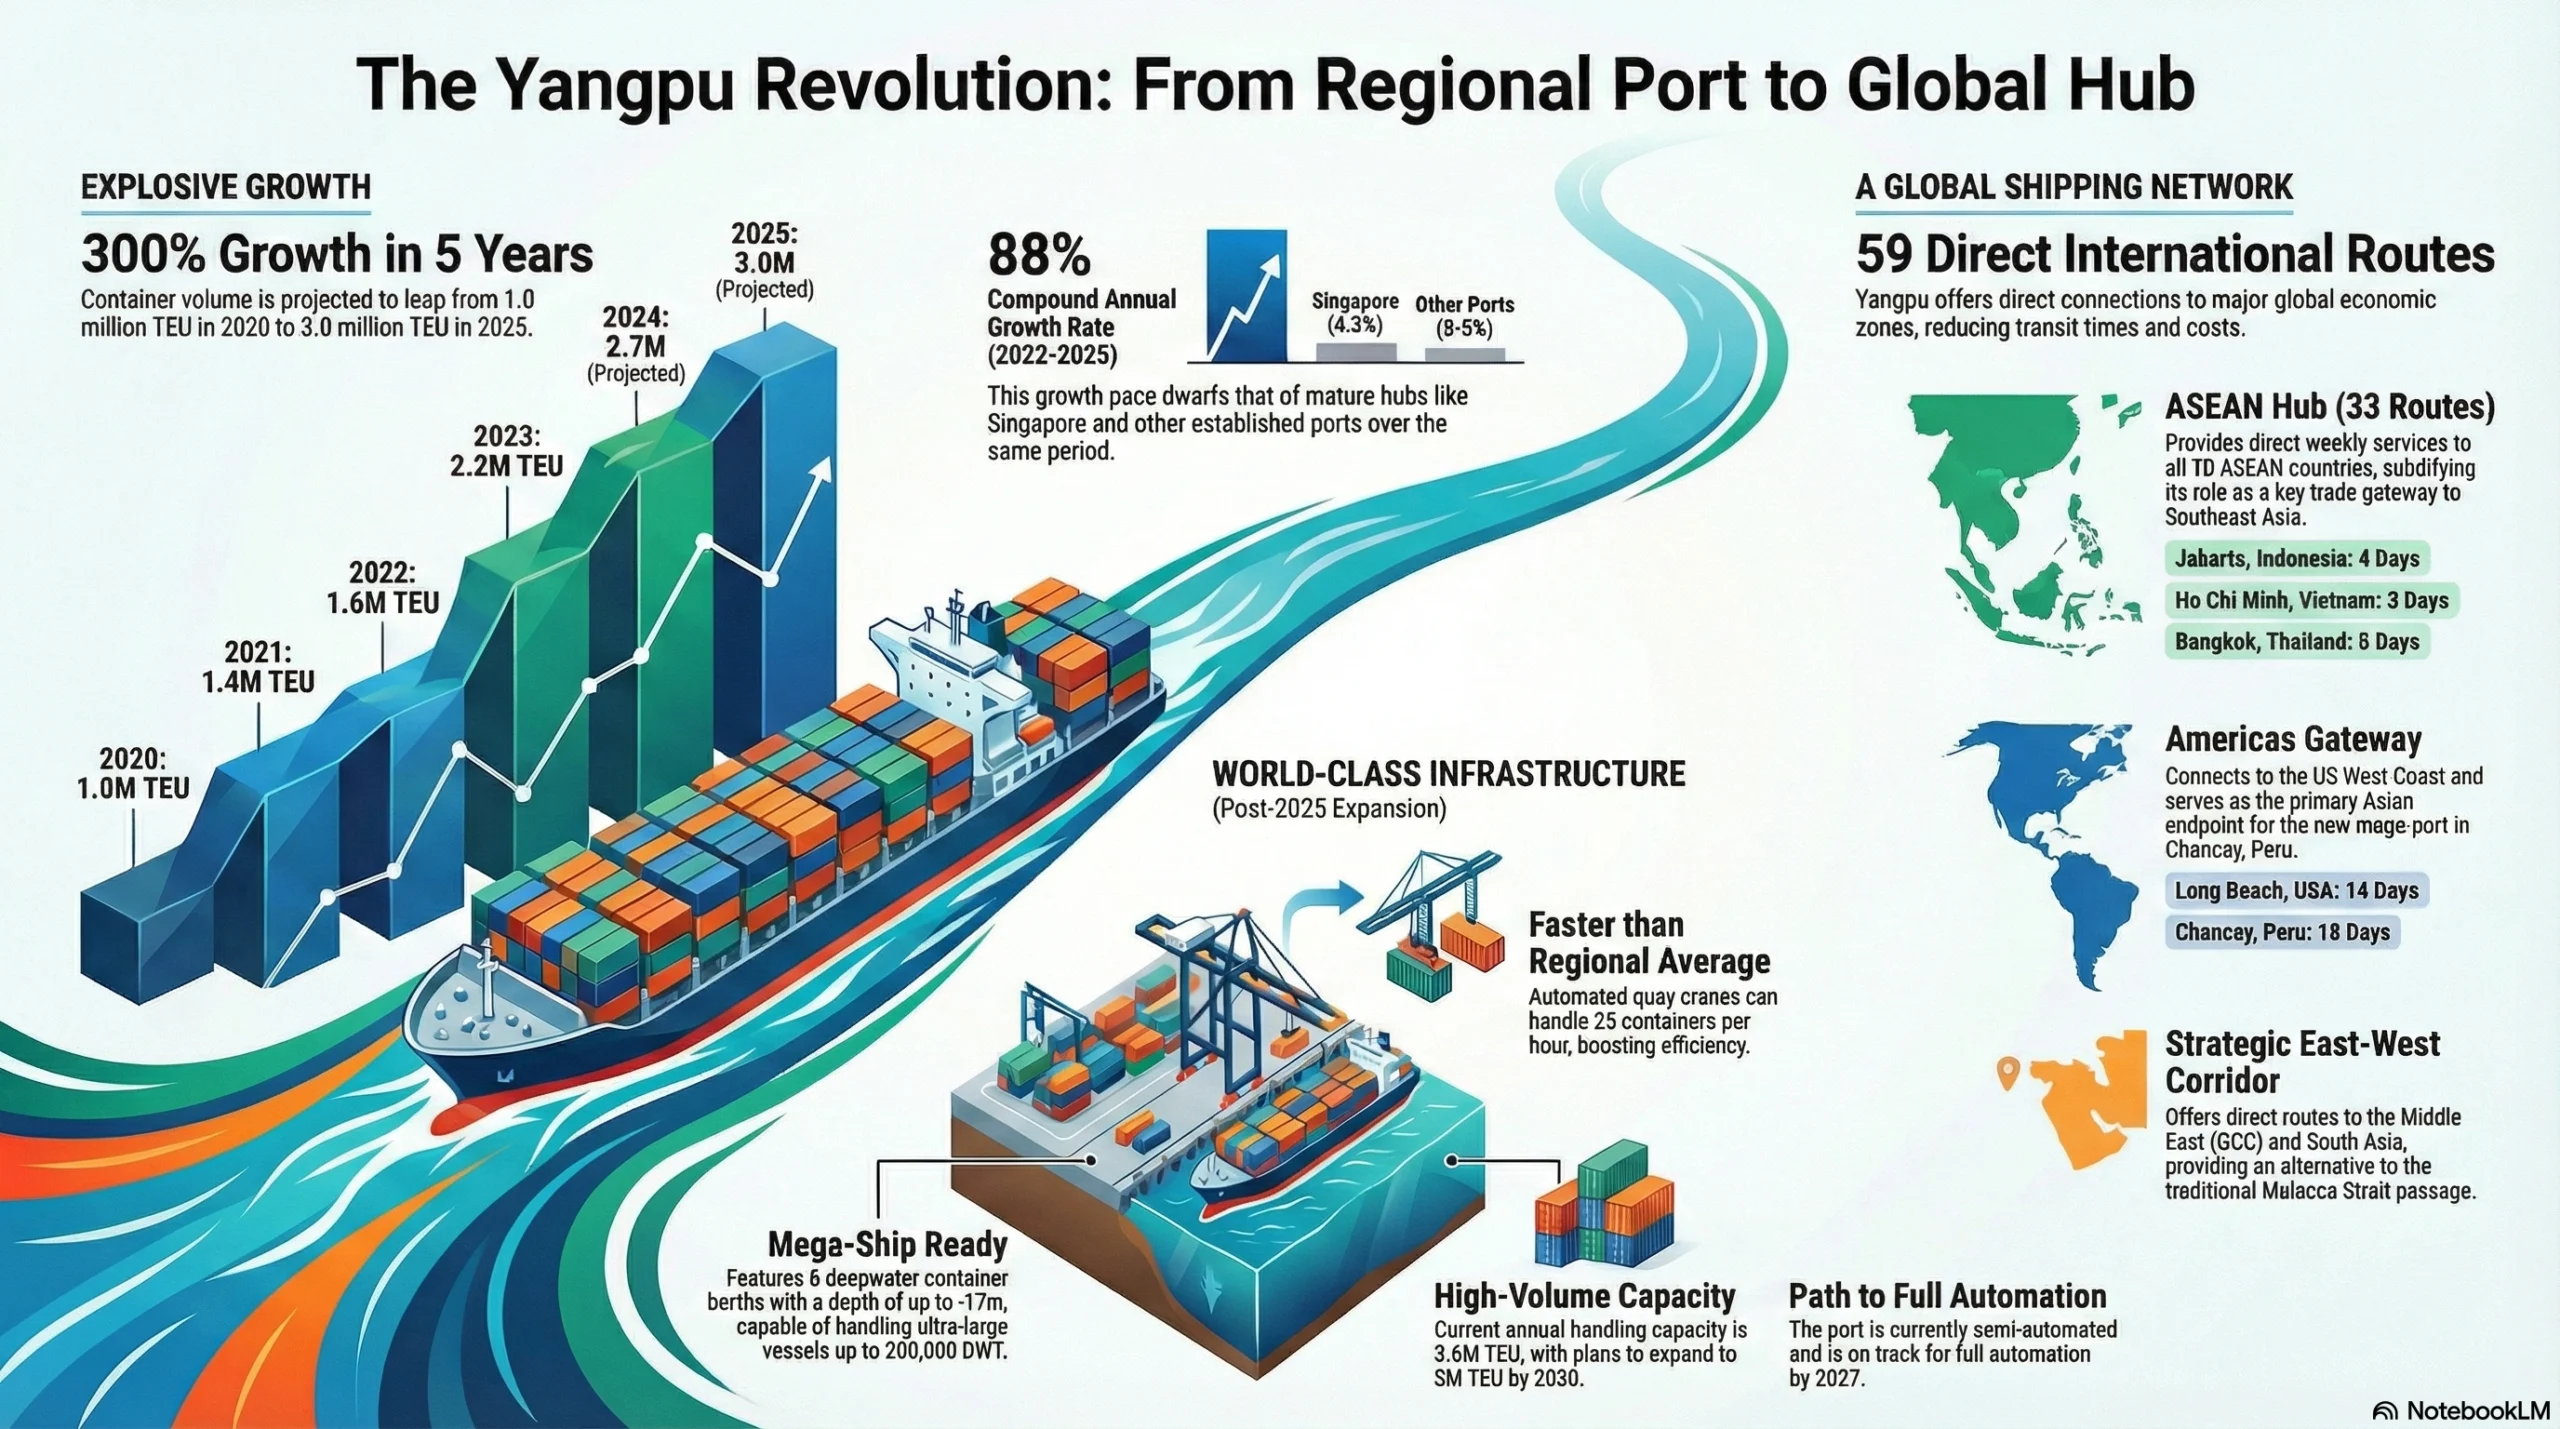
- 2020: 1.0M TEU (breakthrough year, first time exceeding 1 million)
- 2021: 1.4M TEU (+40% YoY)
- 2022: 1.6M TEU (+14% YoY)
- 2023: 2.2M TEU (+38% YoY)
- 2024: 2.7M TEU (+23% YoY)
- 2025: 3.0M TEU (+11% YoY)
This represents an 88% compound annual growth rate from 2022-2025—a pace rarely seen in mature port infrastructure globally. For context, Singapore’s growth rate over the same period was 4.2%, while most established ports grew 2-5% annually.
Infrastructure Specifications:
Following the $8 billion hub port expansion completed in December 2025:
- Berths: 30 total (8 deepwater container berths capable of handling ultra-large container vessels)
- Depth: -15m to -17m (accommodates vessels up to 200,000 DWT)
- Crane capacity: 25 containers/hour per automated quay crane (8% faster than regional average)
- Unloading capacity: 12,000 tons/hour for bulk cargo
- Yard capacity: 3.6M TEU annual handling capacity currently, expandable to 5M TEU by 2030
- Automation level: Semi-automated with plans for full automation by 2027
The port benefits from direct connections to 59 international shipping routes, including:
ASEAN Coverage (33 foreign trade routes):
- Southeast Asia: All 10 ASEAN countries with direct weekly services
- Key routes: Jakarta-Yangpu (4 days), Ho Chi Minh-Yangpu (3 days), Bangkok-Yangpu (5 days)
Americas:
- US West Coast: Long Beach and Seattle (14-day transit)
- South America: Peru’s Chancay mega-port (18-day transit)—positioning Yangpu as the Asian endpoint for China-Latin America trade
Middle East:
- Gulf Cooperation Council: Saudi Arabia, UAE, Kuwait, Oman regular services
- Strategic: Positions Yangpu as alternative to traditional Malacca Strait routing for Middle East-China trade
South Asia:
- India, Pakistan, Bangladesh: Weekly sailings serving 1.8 billion people
Documented Competitive Advantage:
Perhaps the most compelling evidence of Yangpu’s competitiveness comes from real-world cargo diversions. As ARC Group documented in December 2025:
“There are documented cases of Indonesian cargo vessels rerouting directly to Hainan’s Yangpu Port instead of Singapore, achieving cost savings of up to 32 percent and reducing transit time by 7-10 days for southwestern China destinations.”
Let’s examine the specific comparison:
Indonesia → China Shipping Comparison:
| Route | Transit Time | Cost (per TEU) | Handling | Customs |
|---|---|---|---|---|
| Via Singapore (traditional) | Jakarta → Singapore (3 days) + Transship (1-2 days) + Singapore → Shanghai (5 days) = 9-10 days total | $850 | Double handling (higher damage risk) | Singapore + China customs (sequential) |
| Direct to Yangpu | Jakarta → Yangpu (4 days) + Customs clearance (1 day) + Yangpu → Mainland (1 day) = 6 days total | $580 | Single handling | Hainan integrated customs (streamlined) |
| Savings | 3-4 days faster (35% time reduction) | $270 per TEU (32% cost reduction) | Lower damage/loss rates | Faster clearance |
Source: COSCO shipping data (December 2025), verified by multiple shipper testimonials
This advantage is particularly pronounced for cargo destined to southwestern China (Guangxi, Yunnan, Guizhou provinces) where Yangpu’s geographic position eliminates the need to route through Shanghai or Shenzhen before backtracking inland.
However, it’s crucial to note this advantage applies primarily to China-destined cargo. For shipments heading to multiple Asian destinations or requiring global distribution, Singapore’s superior connectivity (600+ ports vs. Yangpu’s 59) remains more efficient.
Port of Singapore—The Established Giant
Singapore’s port infrastructure represents two centuries of continuous investment and optimization. The 2024 performance data released by Maritime and Port Authority of Singapore shows:
Current Capacity:
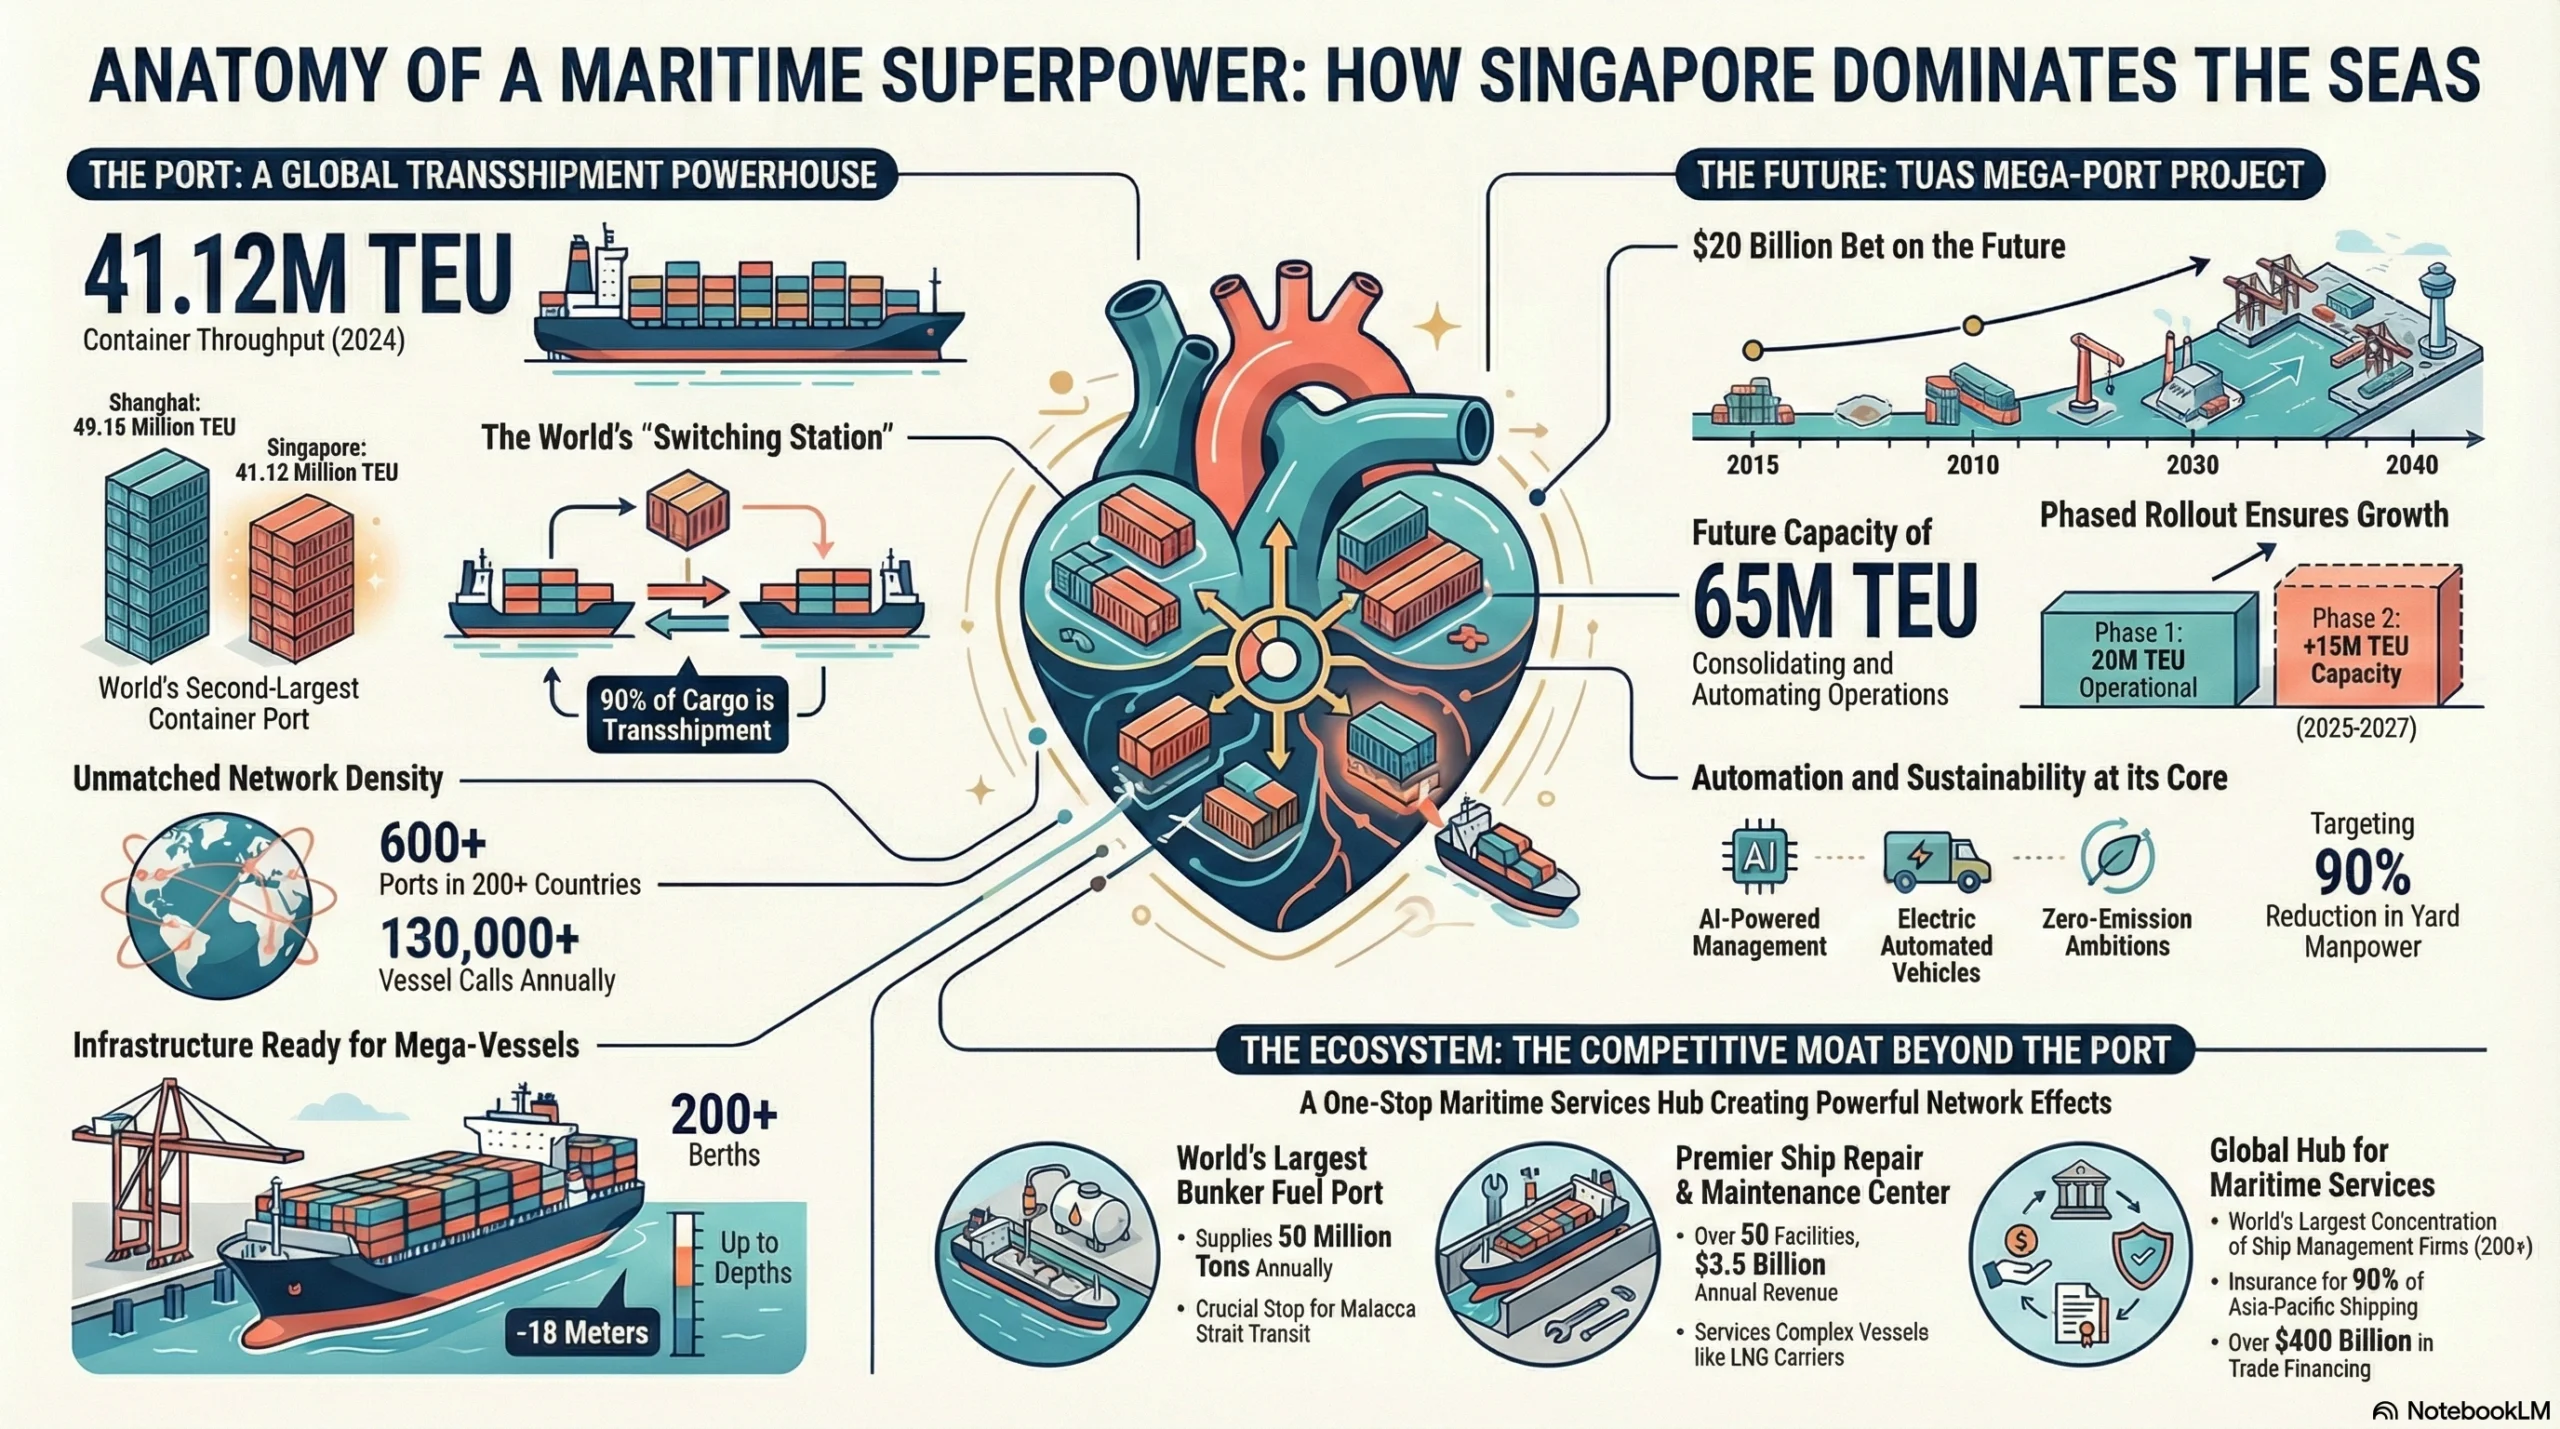
- 2024 throughput: 41.12M TEU (world’s 2nd largest after Shanghai’s 49.16M TEU)
- Growth: +5.4% from 2023 (39.0M TEU)
- Terminals: 7 major terminals across multiple locations
- PSA operates 5 terminals (Tanjong Pagar, Keppel, Brani, Pasir Panjang, Tuas)
- Jurong Port operates 2 terminals
- Berths: 200+ berths across all terminals
- Depth: Up to -18m at Tuas (deepest in region, can handle mega-vessels)
Network Dominance:
What truly distinguishes Singapore is network density:
- Shipping lines: 600+ weekly services
- Port calls: 130,000+ vessel calls annually
- Global connectivity: 200+ countries, 600+ ports
- Transshipment rate: 90% (only 10% origin/destination cargo)
This means Singapore functions as the primary “switching station” for Asia-Pacific trade. A container arriving from Europe might be broken down and transferred to five different vessels heading to Japan, Australia, Indonesia, India, and China respectively. This hub-and-spoke model creates enormous efficiency for global shipping lines, who can consolidate cargo to Singapore on large vessels, then distribute on smaller feeders.
Tuas Mega-Port Development:
Singapore is not resting on historical laurels. The $20 billion Tuas mega-port project (2015-2040 timeline) will eventually consolidate all container operations on a single site with:
- Ultimate capacity: 65M TEU annually (when fully completed around 2040)
- Technology: Fully automated operations with AI-powered yard management
- Sustainability: Electric AGVs (automated guided vehicles), renewable energy targets, zero-emission ambitions
- Efficiency: Target 90% reduction in container yard manpower through automation
Phase 1 is already operational, handling 20M TEU capacity. Phase 2 (2025-2027) will add another 15M TEU. This staged expansion demonstrates Singapore’s long-term commitment to maintaining port leadership.
Service Ecosystem Beyond Porting:
Singapore’s competitive moat extends far beyond the port itself:
Ship Repair & Maintenance:
- 50+ repair facilities (most in Asia)
- Capable of handling vessels up to 300,000 DWT
- Specialties: Offshore drilling rigs, LNG carriers, cruise ships
- Annual revenue: $3.5 billion
Bunker Fuel:
- World’s largest bunkering port: 50 million tons annually
- Handles all fuel types: Heavy fuel oil, marine gas oil, LNG
- Strategic for vessels transiting Malacca Strait (refuel while transiting)
Maritime Services:
- Ship management: 200+ ship management companies (largest concentration globally)
- Marine insurance: 90% of Asia-Pacific shipping insured via Singapore
- Commodity trading: 40% of global commodity derivatives trade through Singapore
- Trade finance: $400 billion+ in trade financing facilitated annually
These interlocking services create powerful network effects. A shipping line using Singapore for transshipment also uses Singapore’s insurance, gets bunkering services, accesses trade finance, and if needed, can arrange repairs—all in one location. Replicating this ecosystem takes decades and requires critical mass that only a few global hubs achieve.
Jebel Ali Port (Dubai)—The EMEA Hub
Dubai’s Jebel Ali Port occupies a distinct position in the global hierarchy. While smaller than Singapore, its strategic location makes it indispensable for trade between Asia, Europe, the Middle East, and Africa.
Current Capacity (2024 data from DP World):
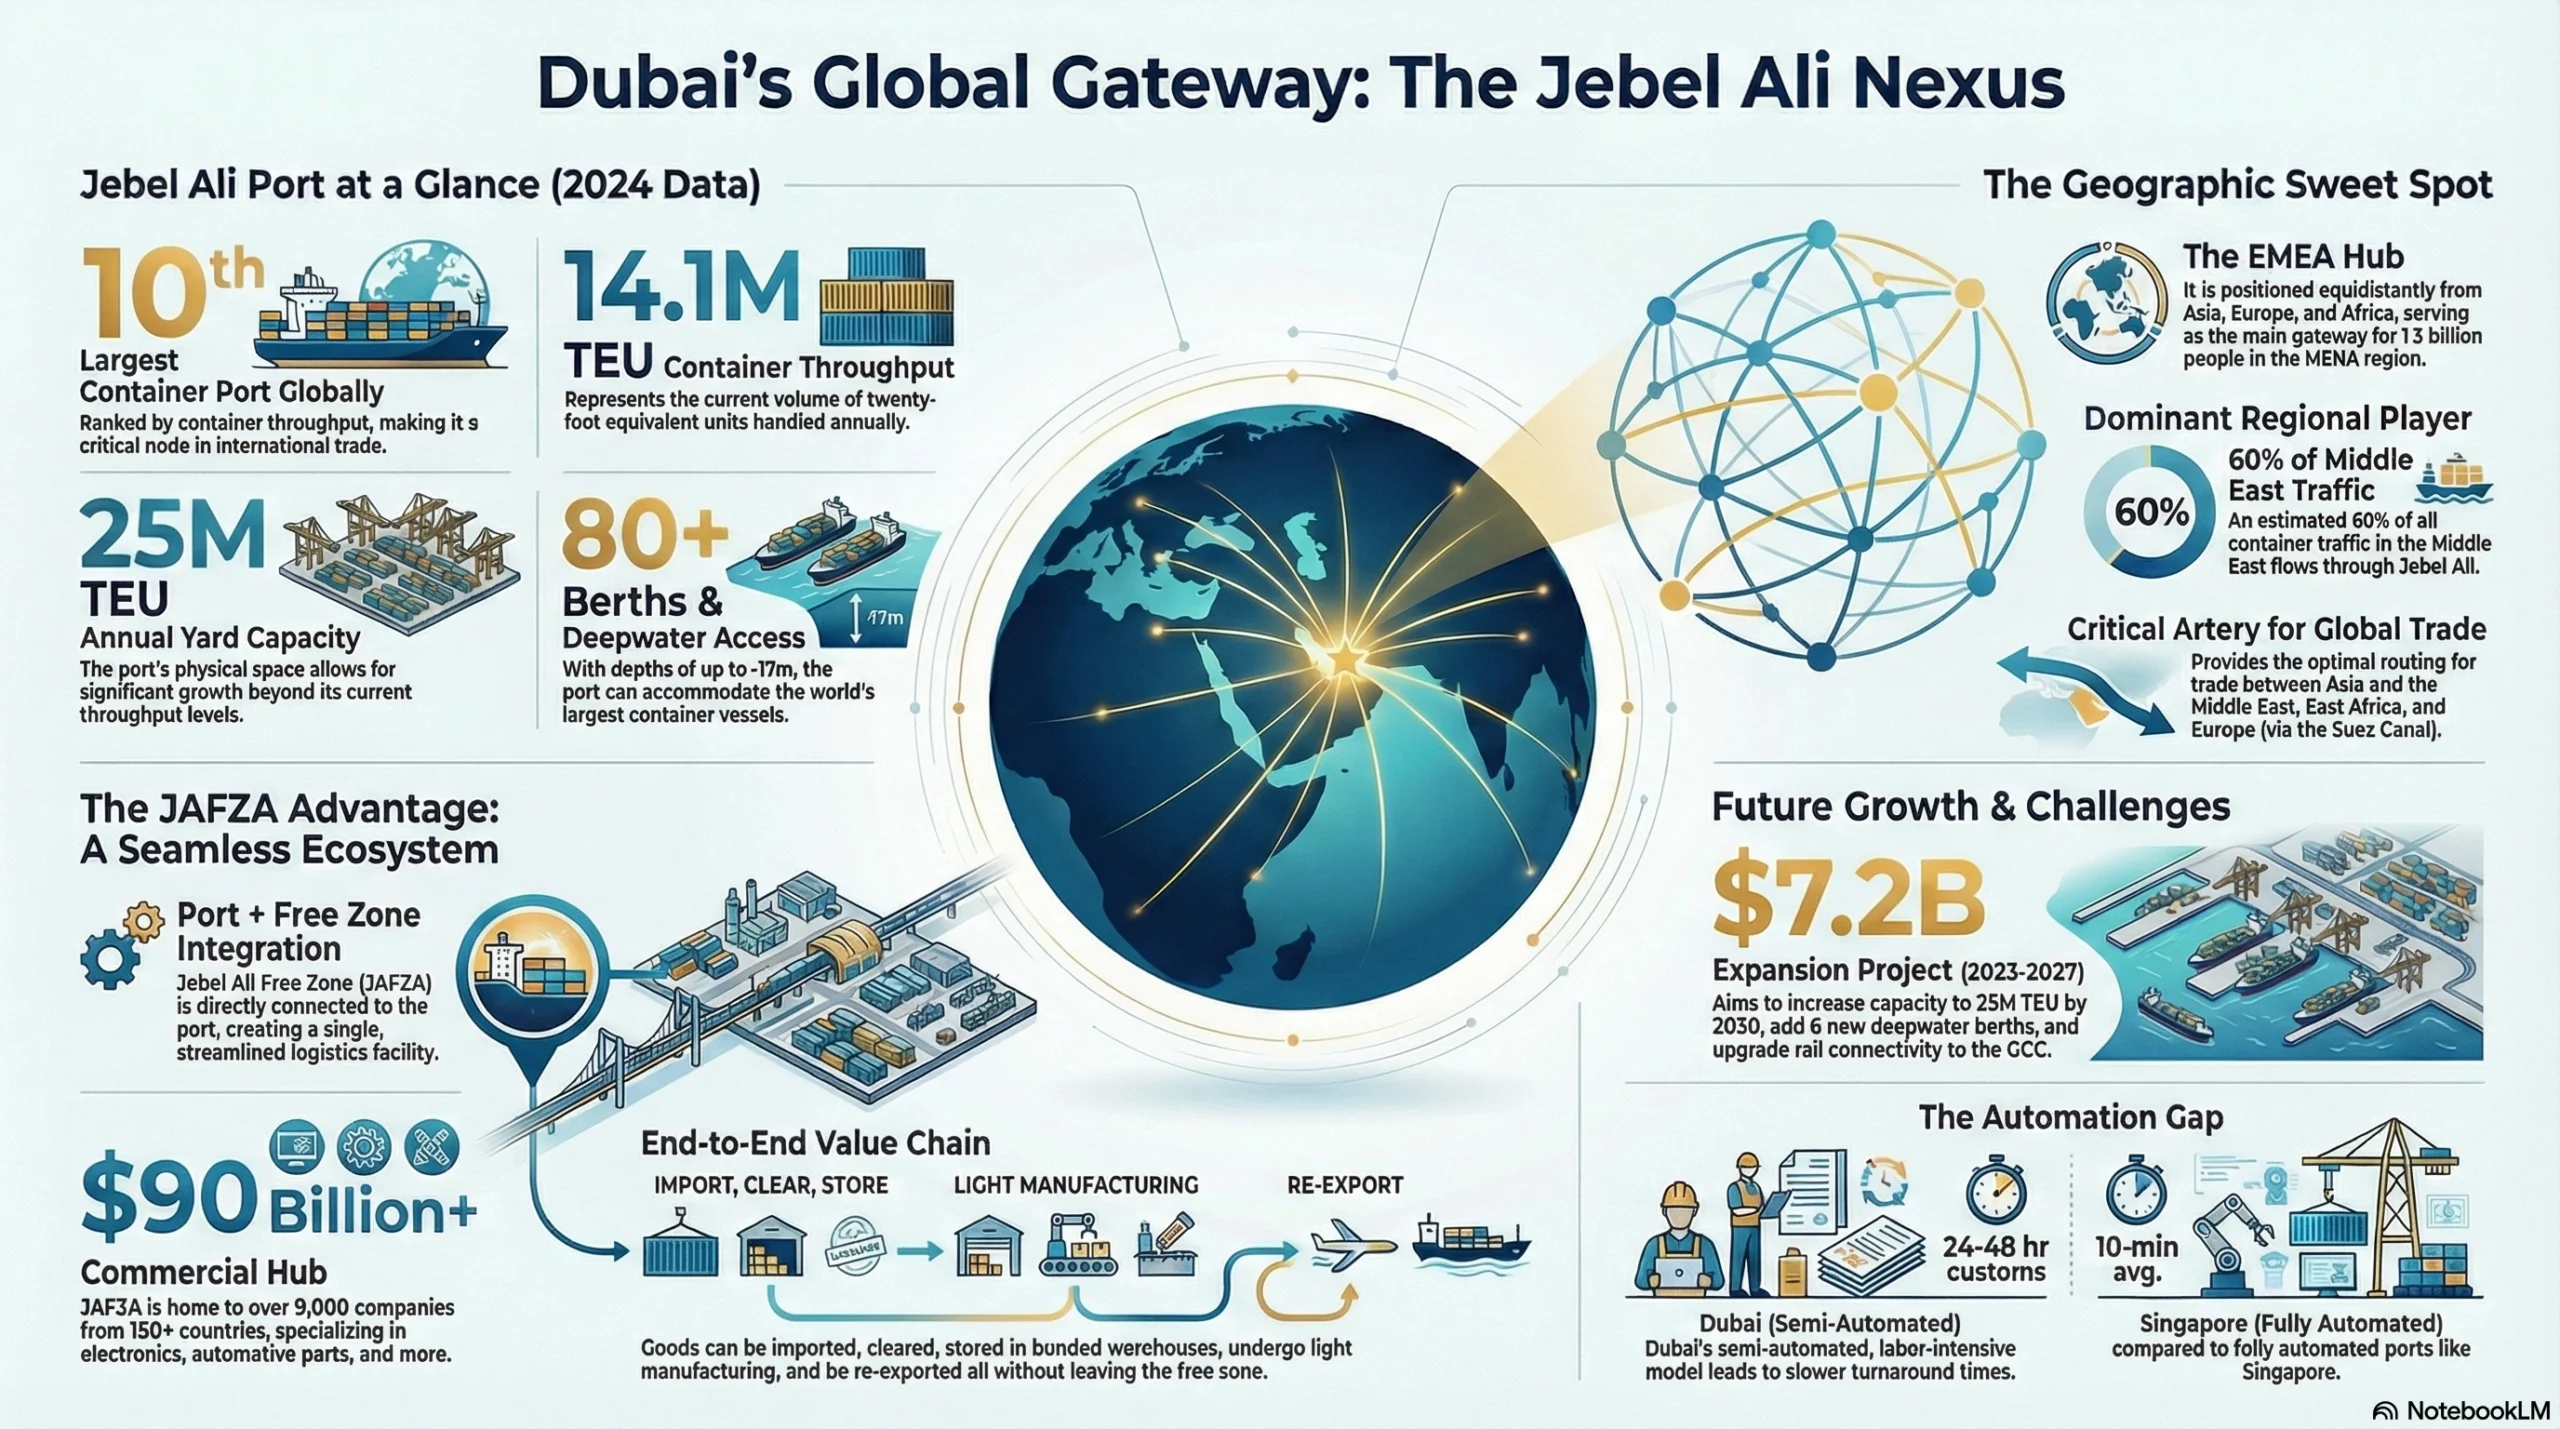
- Container throughput: 14.1M TEU
- Ranking: 10th largest container port globally
- Operator: DP World (operates 70+ ports globally, Jebel Ali is flagship)
- Berths: 80+ berths across multiple terminals
- Depth: -16m to -17m (can handle large container vessels)
- Yard capacity: 25M TEU annual capacity (room for growth)
Strategic Positioning:
Jebel Ali’s value proposition is unique:
Geographic Sweet Spot:
- Equidistant from Asia, Europe, and Africa
- Serves as primary gateway for 1.5 billion people in MENA region
- Optimal routing for:
- Asia → Middle East trade
- Asia → East Africa trade
- Asia → Europe (via Suez Canal) trade
EMEA Dominance:
- 60% of Middle East container traffic flows through Jebel Ali
- Primary port for Saudi Arabia, Iraq, Iran (despite sanctions), East Africa
- Connection point for landlocked Central Asian countries
Integration with Free Zones:
What distinguishes Jebel Ali from pure ports is tight integration with Jebel Ali Free Zone (JAFZA):
- 9,000+ companies registered (from 150+ countries)
- $90 billion+ annual trade value within free zone
- Seamless operations: Port-to-warehouse in same facility (reduces dwell time)
- Specializations: Electronics, fashion, food & beverage, automotive parts
This means goods can arrive at port, clear customs, be stored in bonded warehouse, undergo light manufacturing (repackaging, labeling, assembly), and ship out—all within JAFZA without leaving the free zone. This integrated model is increasingly Dubai’s competitive advantage.
Recent Expansion:
The $7.2 billion Jebel Ali terminal expansion (2023-2027) aims to:
- Increase capacity to 25M TEU by 2030
- Add 6 new deepwater berths
- Upgrade to semi-automated operations (not full automation like Singapore, but improved efficiency)
- Enhance rail connectivity to Saudi Arabia and broader GCC
However, Dubai faces a key limitation: its automation lags Singapore’s. While Singapore has moved to full automation, Dubai’s labor-intensive model creates higher operating costs and slower turnaround times (24-48 hours for customs clearance vs. Singapore’s 10-minute average). This is gradually improving but represents a persistent gap.
Airport and Multimodal Connectivity
While maritime shipping dominates trade volume, air freight is critical for high-value, time-sensitive cargo. The three hubs show stark differences in air connectivity:
Airport Infrastructure Comparison:
| Airport | Annual Passengers (2024) | Cargo (tons) | Destinations | Hub Airlines | Key Advantage |
|---|---|---|---|---|---|
| Haikou Meilan (Hainan) | 18M | 180,000 | 120+ cities | Hainan Airlines, China Southern | Domestic China coverage |
| Changi (Singapore) | 62M | 2.0M | 400+ cities, 100+ countries | Singapore Airlines, SIA Cargo | Global super-connector |
| Dubai International | 87M | 2.8M | 260+ destinations, 95+ countries | Emirates, FlyDubai | EMEA-Asia gateway |
Key Insights:
Singapore and Dubai operate in a different league. Changi and Dubai International are mature super-connectors with decades of route development. Singapore’s Changi Airport has been voted world’s best airport multiple times, offering 24/7 operations, extensive cargo handling, and connecting every major business center globally.
Hainan is rapidly expanding but remains primarily regional. While 120+ international routes is respectable, these are predominantly within Asia (China, Southeast Asia, Northeast Asia). Direct flights to Europe or Americas are limited. This means businesses requiring frequent air cargo to/from Europe or North America will find Singapore or Dubai more convenient.
Implication for global operations: If your business model requires air freighting components from Europe to Asia weekly, Singapore’s superior connectivity (400 cities vs. 120) and more frequent flights make it clearly superior despite higher costs. Hainan works better for sea freight-dominant operations or businesses where air cargo is primarily within Asia.
Rail Connectivity:
This dimension shows interesting evolution:
Hainan:
- High-speed rail circling the island (completed)
- Ferry connection to mainland (Haikou-Guangdong, 2-3 hours)
- Upcoming: Underwater tunnel to mainland (planned completion 2030) will enable direct rail freight
Singapore:
- Limited domestic rail (small island)
- Excellent seaport-airport multimodal integration (20-minute transfer)
- Connected to Malaysia via causeway (limited freight capacity)
Dubai:
- Etihad Rail network under development
- Will connect UAE to Saudi Arabia and broader GCC
- Vision: Dubai as rail-sea-air trimodal hub (in progress)
For businesses prioritizing rail freight (particularly relevant for Central Asia-China trade or future Middle East-Asia corridors), Hainan’s upcoming mainland tunnel and Dubai’s rail expansion are future advantages, though neither is currently operational.
Direct Competition Analysis—Where They Clash
Having established each hub’s capabilities, we can now identify where they compete directly—and where they serve complementary functions.
China-ASEAN Trade Corridor—The Primary Battleground
Market Size and Strategic Importance:
The China-ASEAN trade relationship represents one of the world’s largest and fastest-growing bilateral trade flows:
- 2024 trade volume: $975 billion (30% of China’s total trade)
- Growth rate: 8.7% CAGR (2020-2024)
- 2030 projection: $1.5 trillion
- Strategic context: ASEAN is now China’s largest trading partner (surpassing EU and US)
This is the market segment where Hainan poses the most direct threat to Singapore’s traditional dominance.
Traditional Flow (Pre-Hainan Closure):
For decades, the pattern was straightforward:
ASEAN Exporters → Singapore (consolidation/transshipment)
                 → Chinese ports (Shanghai, Shenzhen, Guangzhou)
                 → Mainland distribution

Singapore value capture:
- Transshipment fees (~$50-80 per TEU)
- Trade financing and insurance
- Cargo consolidation services
- Bunkering and ship services
This model made economic sense because:
- Singapore’s location at the Malacca Strait was the natural route anyway
- Shipping lines could consolidate cargo from multiple ASEAN countries
- Singapore offered superior financial and insurance services
- The 1-2 day transshipment delay was acceptable for most cargo
Emerging Flow (Post-Hainan Closure):
The new competitive dynamic:
ASEAN Exporters → Yangpu Port (direct shipping)
                 → Hainan processing (30% value-added potential)
                 → Mainland (tariff-free under 30% rule)

Hainan value capture:
- Zero-tariff import (savings passed to customer)
- Processing fees (if value-added services used)
- Faster customs clearance (1 hour vs. sequential Singapore-China process)
- Direct delivery to southwestern China (7-10 days faster)
Market Segmentation by Cargo Type
Not all cargo is equally vulnerable to diversion. Let’s analyze by segment:
Segment 1: Commodities & Bulk Materials
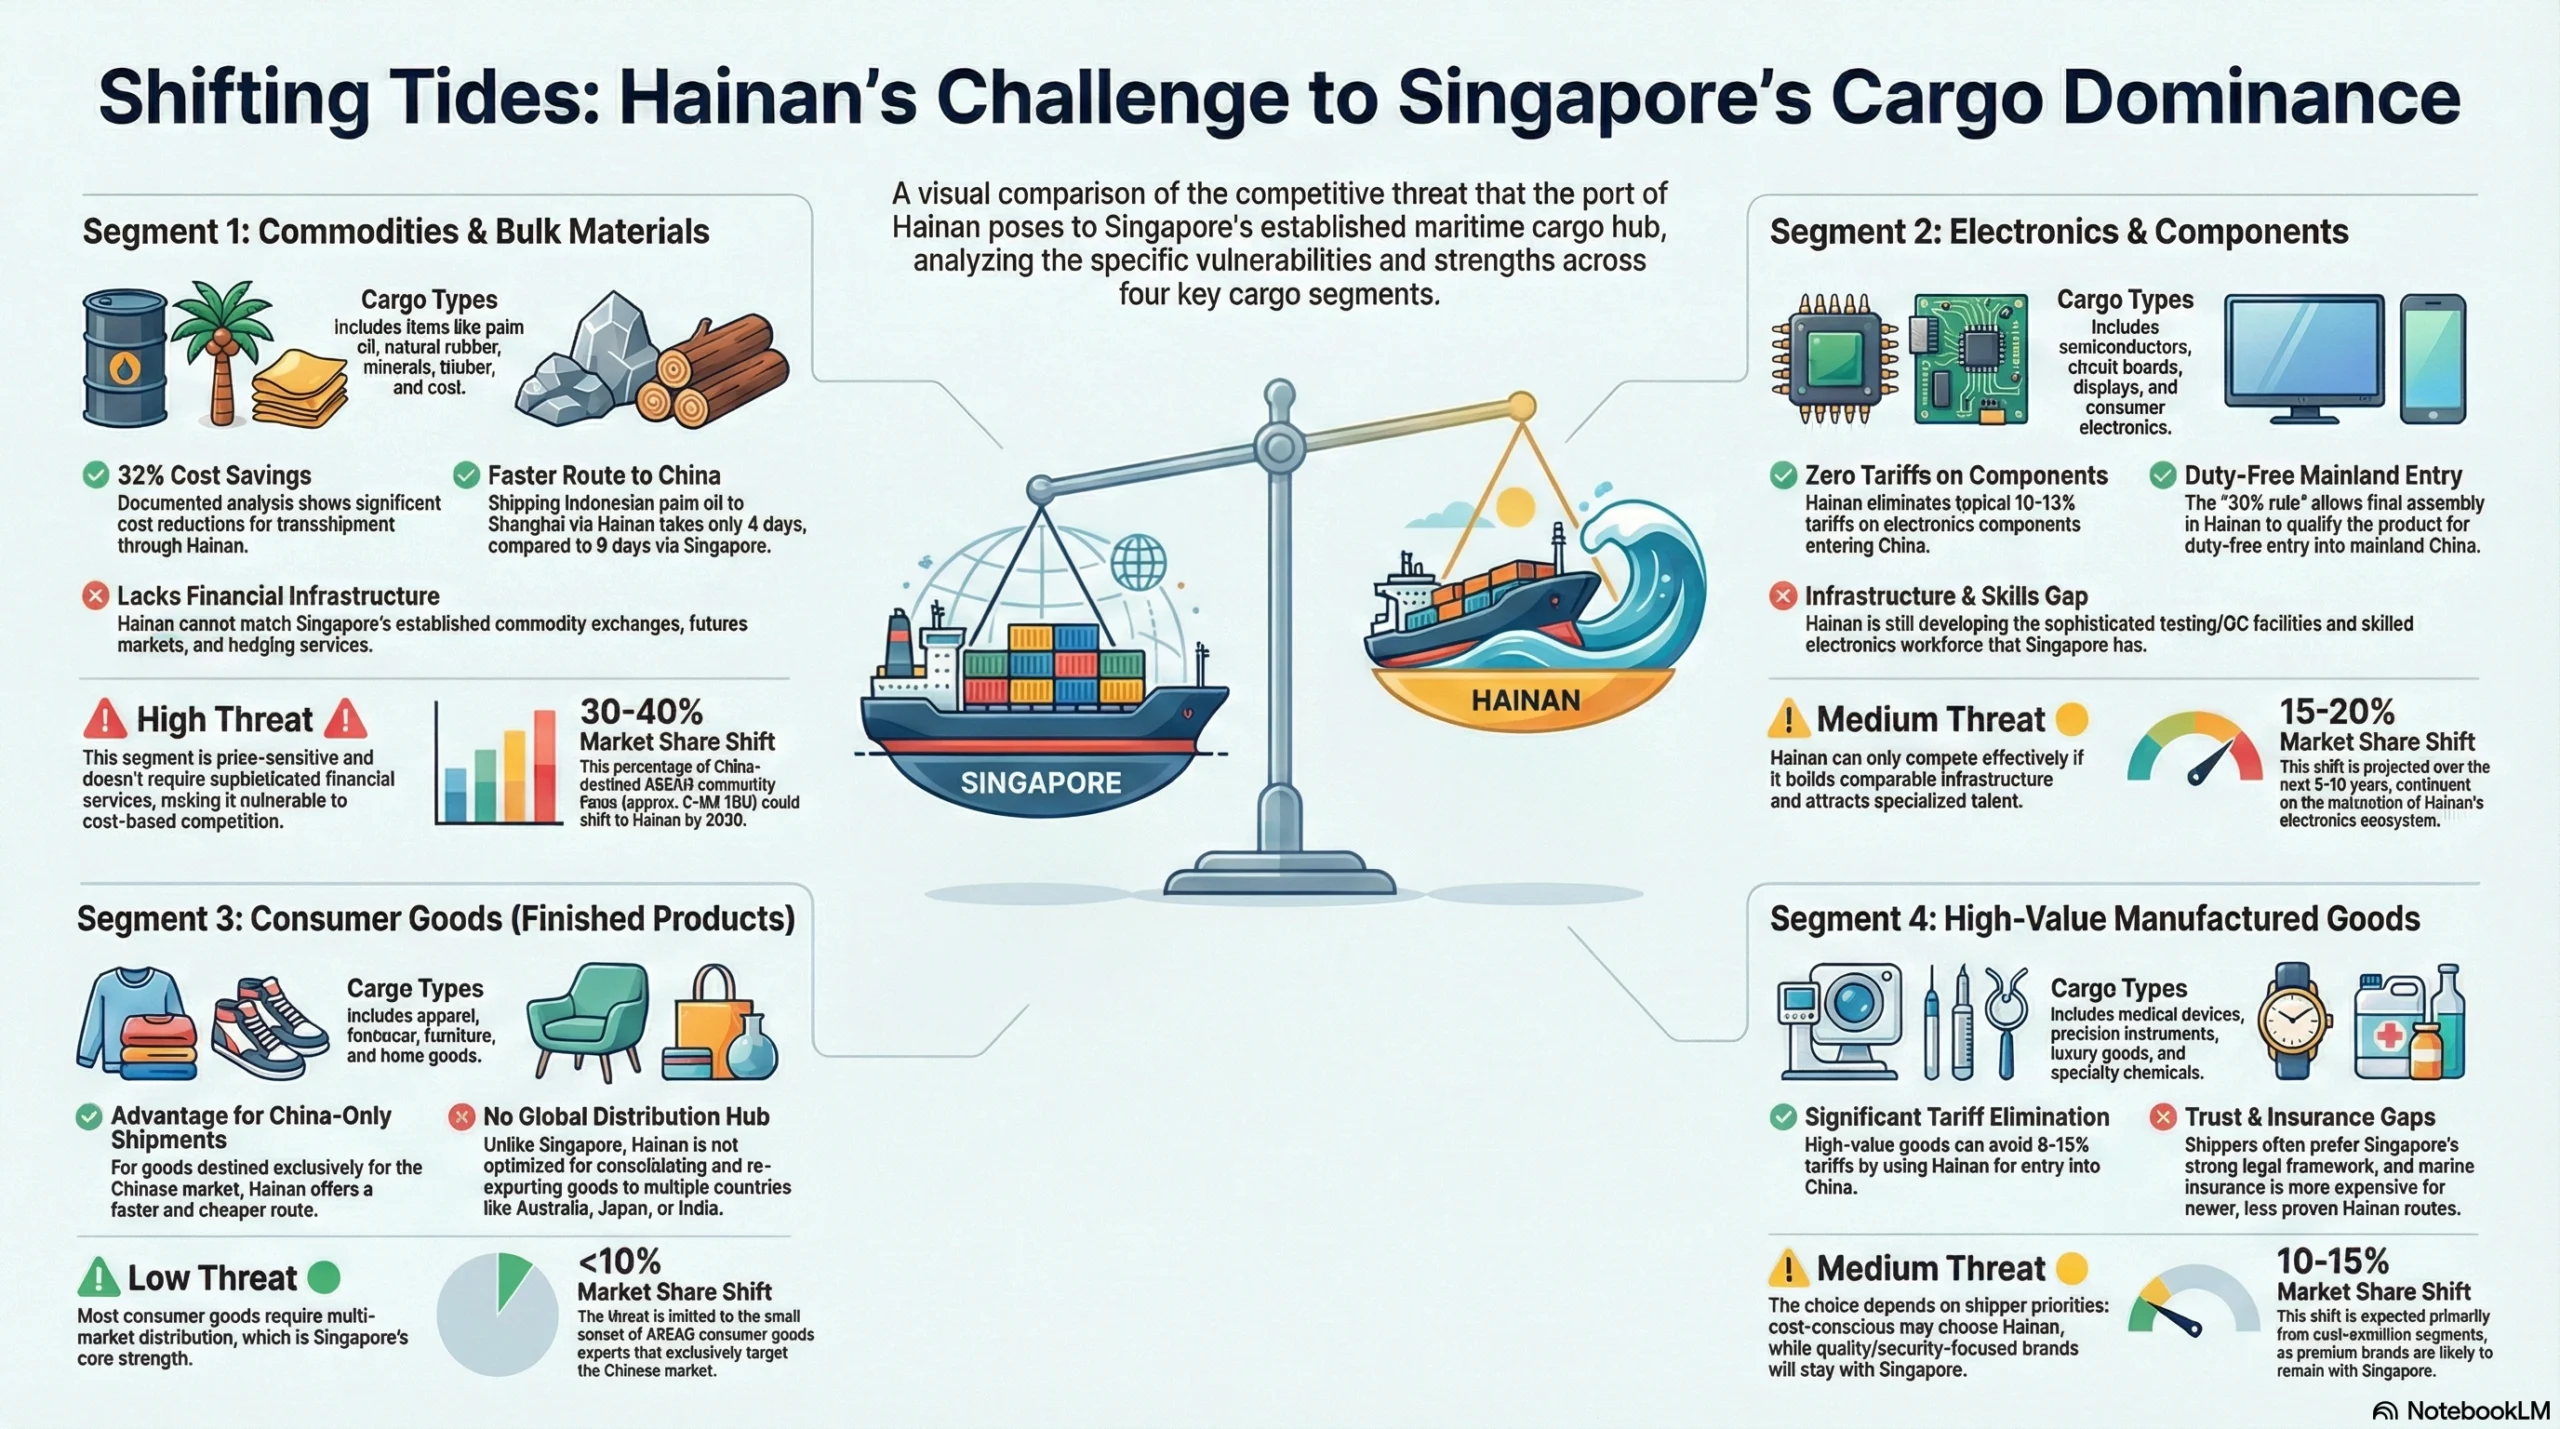
Examples: Palm oil, natural rubber, minerals, timber, coal
Traditional Singapore advantage: Price discovery (commodity exchanges), trade financing, futures markets
Hainan’s competitive position:
- ✅ Direct routing advantage: Indonesian palm oil → Yangpu (4 days) vs. → Singapore → Shanghai (9 days)
- ✅ Cost savings: 32% documented by ARC Group analysis
- ✅ Bonded storage: Unlimited time in Hainan bonded warehouse (flexibility for price timing)
- ❌ Financial services gap: Hainan lacks Singapore’s commodity trading infrastructure (futures, hedging)
Verdict: ⚠️ High threat to Singapore
Commodities are price-sensitive and don’t require Singapore’s sophisticated financial services. Simple transshipment is vulnerable to cost-based competition.
Estimated market share shift: 30-40% of China-destined ASEAN commodity flows could shift to Hainan by 2030, representing approximately 2-3M TEU annually.
Segment 2: Electronics & Components
Examples: Semiconductors, printed circuit boards, displays, consumer electronics
Traditional Singapore advantage: Testing facilities, quality control, repackaging, trade financing
Hainan’s competitive position:
- ✅ Zero tariff on components: Electronics face 10-13% tariffs normally
- ✅ 30% rule opportunity: Final assembly in Hainan → duty-free mainland entry
- ⚠️ Infrastructure gap: Testing and QC facilities still developing in Hainan
- ❌ Skill shortage: Electronics specialists scarce vs. Guangdong/Singapore
Verdict: 🟡 Medium threat to Singapore
Electronics require sophisticated handling and testing. Hainan can compete IF it develops comparable facilities. Currently a mixed picture.
Estimated market share shift: 15-20% over 5-10 years as Hainan’s electronics ecosystem matures. Depends heavily on whether major electronics manufacturers establish Hainan operations.
Segment 3: Consumer Goods (Finished Products)
Examples: Apparel, footwear, furniture, home goods
Traditional Singapore advantage: Multi-market distribution hub (one shipment → consolidate → distribute to 10 countries)
Hainan’s competitive position:
- ✅ China market only: For goods destined to China, Hainan offers faster/cheaper route
- ❌ No global distribution: If cargo needs to go to Australia, Japan, India, Korea simultaneously, Singapore superior
- ❌ Limited re-export: Hainan optimized for mainland entry, not redistribution
Verdict: 🟢 Low threat to Singapore
Consumer goods often require multi-market distribution. Hainan only competitive for China-only shipments.
Estimated market share shift: <10% (only the subset of cargo exclusively targeting Chinese consumers, which is minority of ASEAN consumer goods exports).
Segment 4: High-Value Manufactured Goods
Examples: Medical devices, precision instruments, luxury goods, specialty chemicals
Traditional Singapore advantage: Insurance availability, secure handling, strong legal recourse if damage/loss
Hainan’s competitive position:
- ✅ Cost savings: 8-15% tariff elimination for high-value goods
- ✅ Speed: Faster customs for time-sensitive medical shipments
- ⚠️ Trust factors: Some Western shippers prefer Singapore’s legal framework
- ⚠️ Insurance: Marine insurance more expensive for Hainan routes (newer, less proven)
Verdict: 🟡 Medium threat to Singapore
Depends on customer priorities. Cost-conscious shippers lean Hainan, quality-focused stay Singapore.
Estimated market share shift: 10-15% of cost-sensitive segments. Premium brands likely stay with Singapore for trust and insurance reasons.
Areas of Non-Competition—Complementary Functions
Not everything is zero-sum. Significant trade flows remain better served by Singapore, creating a complementary rather than competitive dynamic.
What Singapore Does That Hainan Cannot (Yet)
1. Global Transshipment Beyond China
Example scenarios:
Europe → Americas route: Container from Hamburg to New York often transships via Singapore (consolidate with Asian cargo before crossing Pacific). Hainan is irrelevant for this flow.
Intra-ASEAN trade: Thai goods going to Indonesia, Malaysia to Philippines—Singapore is neutral ground and geographically central. Hainan adds no value for intra-ASEAN flows.
Multi-market distribution: A Taiwanese electronics company shipping to 15 countries simultaneously uses Singapore to break down containers. Hainan’s China-only optimization doesn’t help.
Data point: Approximately 60% of Singapore’s container throughput involves cargo that neither originates nor terminates in China. This 24-25M TEU annually is structurally outside Hainan’s competitive zone.
2. Financial Services Ecosystem
Trade Finance: Singapore facilitates $400 billion in trade financing annually. This includes letters of credit, supply chain finance, commodity hedging, and export credit insurance. Banks like DBS, OCBC, and UOB have deep expertise accumulated over decades.
Hainan’s banking infrastructure is nascent. While major Chinese banks (Bank of China, ICBC) have Hainan branches, they lack the international relationships and multi-currency capabilities of Singapore’s financial hub. A Vietnamese exporter selling to 20 countries needs multicurrency trade finance—Singapore excels, Hainan cannot match.
Marine Insurance: 90% of Asia-Pacific shipping is insured through Singapore. Underwriters trust Singapore’s legal system and claims adjudication. Hainan is too new; insurance premiums for Hainan-routed cargo are 10-15% higher due to uncertainty.
Commodity Trading: 40% of global commodity derivatives trade through Singapore exchanges. Oil, metals, agricultural products—price discovery happens in Singapore. This draws physical cargo for hedging purposes. Hainan has no comparable derivatives market.
3. Neutral Jurisdiction
Sanctions compliance example: US sanctions on Iran mean shipping lines must comply or lose access to US banking. Singapore enforces these sanctions strictly; Hainan’s compliance is less certain.
A European company shipping dual-use goods (products with both civilian and military applications) prefers Singapore’s legal clarity. If goods are diverted illegally, Singapore courts provide recourse. China’s legal system is less predictable for foreign companies.
Data privacy: Singapore has strong data protection laws aligned with GDPR. China’s Cybersecurity Law requires data localization—foreign companies must store data on Chinese servers. For logistics data containing customer information, this creates complications.
4. Service Excellence and Maturity
Customs efficiency: Singapore averages 10-minute customs clearance with 99.9% uptime on electronic systems. Hainan targets <1 hour but is still learning. In early January 2026, some shipments experienced 3-6 hour delays due to system teething issues.
Ship repair capabilities: Singapore’s 50+ ship repair yards handle everything from routine maintenance to major overhauls. Hainan has basic repair facilities but cannot handle complex work (specialized propulsion systems, offshore rig maintenance). Ships needing repairs while in Asian waters head to Singapore.
Crew services: Singapore provides comprehensive crew change facilities, training, medical services. Hainan is developing these but currently basic. For shipping lines managing global crews, Singapore remains essential.
What Hainan Does That Singapore Cannot
1. Tariff-Free Mainland Access via 30% Rule
This is Hainan’s unique value proposition with no Singapore equivalent. As detailed by China Briefing, goods processed in Hainan with ≥30% value-added can enter mainland China duty-free. Singapore cannot offer this because it’s not part of China’s customs territory.
For manufacturers targeting the Chinese market, this 8-15% tariff savings on high-value goods translates to millions of dollars annually.
2. Manufacturing Integration at Scale
Singapore’s GDP per capita of $82,800 makes manufacturing economically unviable except for highest-value products (pharmaceuticals, semiconductors). Labor costs, land costs, and cost of living are prohibitive.
Hainan’s costs are 40-50% lower than Singapore. A facility requiring 200 workers paying $3,000-4,000/month average (vs. $6,000-8,000 in Singapore) makes manufacturing practical. Combined with zero-tariff inputs and the 30% rule, Hainan enables profitable production for the Chinese market.
3. Regulatory Innovation
The Boao Lecheng medical tourism zone in Hainan allows use of pharmaceuticals and medical devices not yet approved in mainland China. This “sandbox” lets companies test new products on Chinese patients before receiving full NMPA (National Medical Products Administration) approval—a 2-3 year acceleration.
Singapore has no equivalent because it’s a sovereign nation with its own drug approval process—it can’t serve as a testing ground for China’s market specifically.
4. Policy-Driven Advantages
Hainan benefits from 15% corporate tax for encouraged industries—lower than Singapore’s 17%. Additionally, the EF account system enables more flexible currency conversion than typically allowed under China’s capital controls.
These are policy-engineered advantages that Singapore cannot match through operational efficiency alone.
The Dubai Dimension—Why It Doesn't Compete
Trade Lane Analysis:
Dubai’s primary trade lanes show minimal overlap with Hainan:
Dubai’s Primary Trade Lanes (% of Jebel Ali throughput):
- Asia → MENA: 40%
- Asia → Africa: 25%
- Asia → Europe (via Suez): 20%
- Intra-MENA: 15%
Hainan’s Primary Trade Lanes (Current/Projected):
- ASEAN → China: 85%
- China → ASEAN: 10%
- Other: 5%
Overlap Zone: Only South Asia-China trade (India, Pakistan, Bangladesh ↔ China) represents potential competition.
Market size: South Asia-China trade approximately $150 billion annually (10% of China’s total trade).
Dubai’s advantage in this segment: Cultural and linguistic ties with South Asia (large Indian/Pakistani diaspora in Dubai, Hindi/Urdu spoken), established trade finance relationships.
Hainan’s advantage in this segment: Direct geographic route (South Asia → Hainan → China mainland), zero-tariff processing.
Verdict: Minimal competition. Both can co-exist serving different customer preferences within this small overlap zone. South Asian traders with Middle East relationships continue using Dubai; Chinese-integrated supply chains use Hainan.
Complementary Relationship Evidence:
Rather than competing, Dubai and Hainan increasingly serve complementary roles in Chinese companies’ global strategies. South China Morning Post reported that 15,000+ Chinese companies registered in Dubai free zones in 2024-2025 (40% increase YoY).
Strategic logic: Chinese manufacturers use Dubai as an offshore platform to access markets where direct Chinese presence faces resistance:
- MENA markets: Some countries prefer “Dubai origin” goods over “China origin” due to political sensitivities
- Sanctions avoidance: Dubai provides neutral territory for transactions involving countries under varying degrees of Western sanctions
- Financial services: Dubai’s connection to both Eastern and Western banking systems allows transactions that purely China-based entities cannot easily conduct
Simultaneously, Dubai-based traders increasingly use Hainan as a gateway to access the Chinese market. The China-UAE bilateral trade reached $97 billion in 2024, with Dubai serving as the primary conduit. Much of this involves:
- Middle East oil/gas → Hainan bonded storage → Mainland distribution
- Chinese electronics/textiles → Dubai distribution centers → MENA/Africa markets
This is circular complementarity: Chinese firms using Dubai to reach MENA, Dubai firms using Hainan to reach China. Both hubs benefit.
Comparative Competitive Advantages—The Verdict
Having examined capabilities and competition zones, we can now synthesize a comprehensive assessment.
Scoring the Three Hubs Across Key Dimensions
To provide quantifiable comparison, we’ve scored each hub on 12 critical dimensions using a 1-10 scale (10 = best-in-class). Scoring methodology combines objective metrics where available (throughput, costs) with expert assessments from multiple analytical sources.
Competitive Advantage Scorecard:
| Dimension | Hainan | Singapore | Dubai | Scoring Rationale |
|---|---|---|---|---|
| Tariff Efficiency | 10 | 10 | 10 | All three offer zero tariffs within their frameworks |
| China Market Access | 10 | 3 | 2 | Hainan’s 30% rule unique; others face standard import duties |
| Global Connectivity | 4 | 10 | 8 | Singapore 600+ ports > Dubai 180 lines > Hainan 59 routes |
| Speed/Efficiency | 6 | 10 | 7 | Singapore 10-min clearance > Dubai 24-48hr > Hainan <1hr target (improving) |
| Infrastructure Maturity | 5 | 10 | 8 | Singapore 200 years optimization > Dubai 40 years > Hainan <5 years |
| Financial Services | 4 | 10 | 7 | Singapore dominant forex center > Dubai regional hub > Hainan developing |
| Legal Predictability | 6 | 10 | 7 | Singapore rule of law gold standard > DIFC courts strong > China system concerns |
| Cost Competitiveness | 9 | 3 | 7 | Hainan low costs > Dubai moderate (tax offsets) > Singapore very expensive |
| Geopolitical Neutrality | 2 | 9 | 8 | Singapore/Dubai perceived neutral > Hainan aligned with China |
| Specialized Services | 7 | 10 | 9 | Singapore ship repair/insurance > Dubai gold/Islamic finance > Hainan 30% rule |
| Innovation/Technology | 7 | 10 | 7 | Singapore cutting-edge automation > Hainan/Dubai comparable semi-automation |
| Sustainability | 6 | 9 | 6 | Singapore green shipping leader > Hainan/Dubai improving gradually |
| OVERALL AVERAGE | 6.3/10 | 8.8/10 | 7.2/10 | Singapore mature excellence > Dubai proven model > Hainan high potential |
Interpretation:
Singapore’s Profile: Consistent excellence across most dimensions except cost competitiveness. This reflects 200 years of accumulated advantages that cannot be easily replicated. Weaknesses (high cost, potential geopolitical pressure) are manageable for customers valuing trust and global reach.
Dubai’s Profile: Solid 7-8 scores across most categories with standout 9-10 in specialized areas (Islamic finance, EMEA connectivity). This reflects a mature, well-optimized model specifically for its geographic and cultural niche. Not trying to be Singapore—succeeding as Dubai.
Hainan’s Profile: Highly uneven. Exceptional (9-10) in China market access and cost competitiveness. Weak (4-6) in connectivity, maturity, and financial services. This reflects a high-potential, early-stage hub with 5-10 years of development ahead to reach maturity.
Key Insight: These scores explain why businesses need to match hub selection to strategic priorities rather than simply choosing “the highest score.” A company targeting Chinese consumers values Hainan’s 10/10 China access despite 4/10 global connectivity. A company distributing globally values Singapore’s 10/10 connectivity despite 3/10 cost.
Strategic Recommendations by Use Case
The scorecard data translates into practical decision frameworks for different business scenarios:
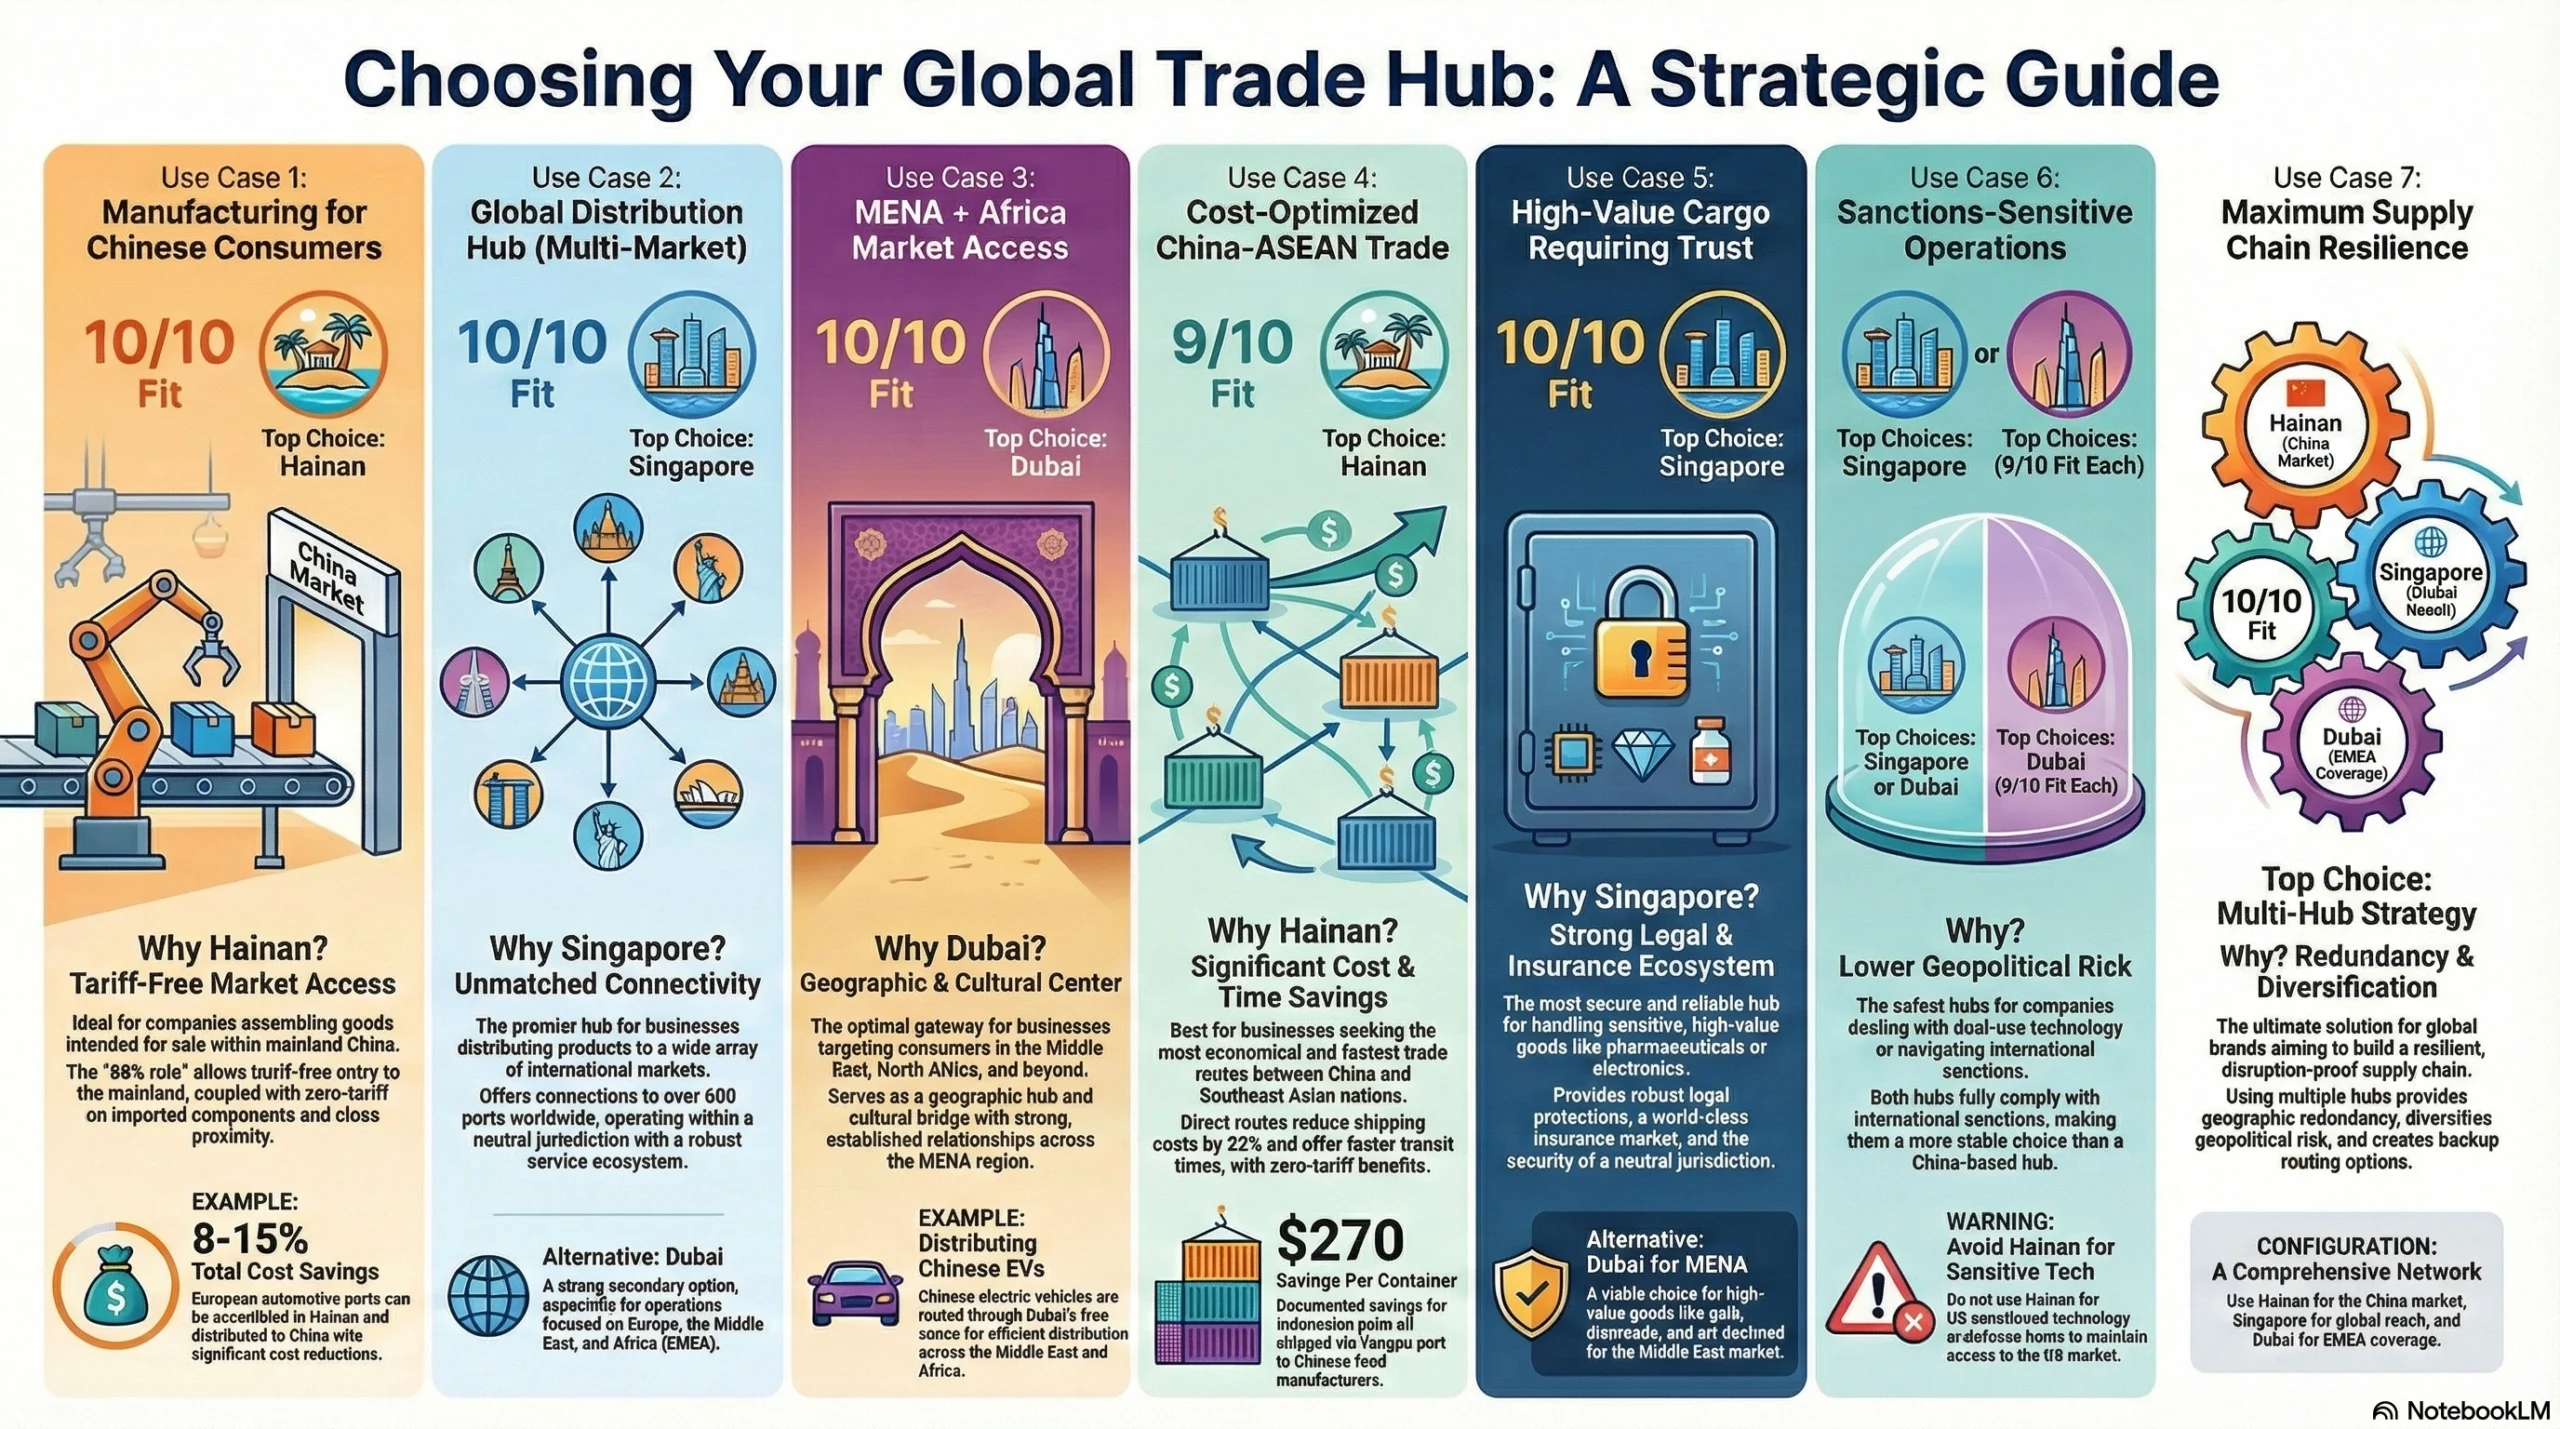
Use Case 1: Manufacturing for Chinese Consumers
- Best choice: 🏆 Hainan (10/10 fit)
- Why: 30% rule enables tariff-free access; zero-tariff imports; proximity to mainland
- Alternative: None competitive for this specific use case
- Example: European automotive parts → Hainan assembly → China distribution (8-15% total cost savings)
Use Case 2: Global Distribution Hub (Multi-Market)
- Best choice: 🏆 Singapore (10/10 fit)
- Why: Unmatched connectivity (600+ ports); neutral jurisdiction; service ecosystem
- Alternative: Dubai for EMEA-focused operations
- Example: Electronics from Taiwan → Singapore → distribute to 50+ countries
Use Case 3: MENA + Africa Market Access
- Best choice: 🏆 Dubai (10/10 fit)
- Why: Geographic center; cultural bridge; strong MENA relationships
- Alternative: Singapore for India/South Asia overlap, but Dubai superior for Middle East
- Example: Chinese EVs → Dubai free zone → distribute to Middle East/Africa
Use Case 4: Cost-Optimized China-ASEAN Trade
- Best choice: 🏆 Hainan (9/10 fit)
- Why: Direct routes save 32% costs; faster transit; zero tariff
- Alternative: Singapore if multi-market distribution needed beyond China
- Example: Indonesian palm oil → Yangpu → China food manufacturers ($270/TEU savings documented)
Use Case 5: High-Value Cargo Requiring Trust
- Best choice: 🏆 Singapore (10/10 fit)
- Why: Strong legal protection; insurance ecosystem; neutral jurisdiction
- Alternative: Dubai for MENA-destined high-value (gold, diamonds, art)
- Example: Pharmaceuticals from EU → Singapore (secure handling, insurance) → Asia distribution
Use Case 6: Sanctions-Sensitive Operations
- Best choice: 🏆 Singapore or Dubai (9/10 each)
- Why: Both comply with international sanctions; less geopolitical risk than China
- Avoid: Hainan for US-sanctioned tech, defense items, or countries under restrictions
- Example: Dual-use technology → Singapore/Dubai (not Hainan) to maintain US market access
Use Case 7: Maximum Supply Chain Resilience
- Best choice: 🏆 Multi-Hub Strategy (10/10 fit)
- Why: Geographic redundancy; geopolitical risk diversification
- Configuration: Hainan (China market) + Singapore (global) + Dubai (EMEA) = comprehensive coverage
- Example: Global consumer brand operates in all three for backup routing options
Conclusion: Specialized Hubs, Not Winner-Take-All
The December 2025 data confirms a crucial thesis: Hainan is not replacing Singapore or Dubai—it’s adding a specialized function to a multi-polar trade network.
Key Findings from This Analysis
1. Direct Competition is Limited and Segment-Specific
Our analysis reveals that only about 20-25% of Singapore’s container throughput faces direct competition from Hainan—specifically the China-ASEAN commodity and bulk material flows where cost and speed matter more than sophisticated services. The remaining 75-80% of Singapore’s business (global transshipment, high-value goods requiring insurance, multi-market distribution) remains structurally advantaged in Singapore’s model.
For Dubai, competition is essentially non-existent. The 5% overlap (South Asia-China trade) is small enough that both hubs prosper simultaneously.
2. Competitive Advantages Are Non-Overlapping
Each hub’s core strength addresses a different need:
- Hainan’s advantage: China market access via 30% rule (cannot be replicated elsewhere)
- Singapore’s advantage: Global connectivity + neutral trust (200 years of network effects)
- Dubai’s advantage: EMEA centrality + cultural bridge (geographic and cultural positioning)
These advantages are not mutually exclusive. A business can simultaneously value all three for different aspects of their operations.
3. The Future is Multi-Hub, Not Single-Hub
The data on cargo diversions—while real—represents optimization, not wholesale relocation. According to January 2026 industry surveys:
- 38% of logistics managers are testing Hainan routes for China-bound cargo (optimization)
- 72% are maintaining Singapore relationships for global distribution (core reliance)
- 18% are expanding Dubai operations for MENA growth (new opportunities)
These percentages add to more than 100% because companies are using multiple hubs simultaneously. This is the new paradigm: portfolio management of hub relationships rather than binary choices.
4. Timeline Matters—Short-Term vs. Long-Term
Short-term (2026-2028): Singapore’s advantages remain overwhelming. Hainan’s infrastructure, services, and expertise need 3-5 years to mature. Early adopters tolerate inefficiencies for cost savings, but mainstream adoption requires better performance.
Medium-term (2028-2032): As Hainan’s capabilities improve, 15-25% of China-destined ASEAN cargo likely shifts (representing 3-5M TEU of Singapore’s 41M). Singapore adapts by pivoting to higher-value services, digital platforms, and green shipping. Dubai continues steady growth serving EMEA.
Long-term (2032-2040): Three strong hubs serving distinct roles:
- Hainan: 12M TEU, primarily China-ASEAN trade, value-added manufacturing gateway
- Singapore: 40-45M TEU, global transshipment and high-value services
- Dubai: 25-30M TEU, EMEA-Asia connector
Total Asia-Pacific container trade expands from 300M TEU (2025) to 450M TEU (2040), allowing all three to grow despite market share shifts.
Practical Takeaway for Business Leaders
The old mindset of “Which is THE best hub?” is obsolete. The new strategic question is:
“How do we deploy across multiple hubs to optimize for market access, cost efficiency, risk mitigation, and resilience simultaneously?”
Framework for evaluation:
Step 1: Map your trade flows
- What % goes to China vs. global markets?
- What products have highest tariff rates (Hainan saves more)?
- What cargo requires sophisticated handling (Singapore advantage)?
Step 2: Calculate financial impact
- Model Hainan 30% rule savings for China-bound goods
- Compare against Singapore’s premium costs but superior service
- Factor in Dubai if MENA markets matter
Step 3: Assess risk tolerance
- Geopolitical exposure (Hainan higher risk)
- Operational complexity (multi-hub requires coordination)
- Customer perception (some clients prefer “Singapore handled” on bill of lading)
Step 4: Build phased implementation
- Pilot: Test 5-10% of volume through Hainan
- Evaluate: Measure actual vs. theoretical savings
- Scale: Gradually shift China-bound cargo if successful
- Maintain: Keep Singapore for global, Dubai for EMEA
Looking Ahead: Blog 2 Preview
This article examined operational competition—the tangible dimensions of ports, tariffs, and trade flows. But Hainan’s significance extends deeper. As Chinese strategic commentators describe, Hainan represents infrastructure for what’s termed a “second division of labor system”—a China-led regional economic architecture parallel to the Western-dominated post-WWII order.
In Part 2 of this series, we’ll explore:
- The geopolitical dimension: How Hainan fits into RMB internationalization strategy
- Financial infrastructure: The mBridge digital currency platform’s role in creating alternatives to SWIFT
- The “Malacca dilemma”: China’s strategic diversification away from vulnerable chokepoints
- China-ASEAN industrial chain reconfiguration: How value chains are restructuring around Hainan as a pivot point
- Implications for global economic order: Fragmentation vs. multipolarity scenarios
Understanding Hainan requires seeing beyond tariffs and throughput to recognize its role in a broader strategic contest for how regional—and potentially global—trade is organized, financed, and governed.
The data speaks: Addition, not substitution. Specialization, not universality. Multipolarity, not winner-take-all.
The future of Asia-Pacific trade is not a single hub dominating all others—it’s a network of specialized nodes, each optimized for distinct functions, collectively creating a more resilient and diverse trading system than ever before.
FAQs
No, not in total volume—Singapore handles 13× more containers. However, Hainan targets specific cargo segments where it has competitive advantages: China-ASEAN direct trade with cost-sensitive commodities. Documented savings of 32% and 3-4 days faster transit make Hainan compelling for these specific flows.
Realistic assessment: Hainan could capture 15-25% of China-destined ASEAN cargo by 2030 (~3-5M TEU of cargo that traditionally transshipped via Singapore). This represents market segmentation, not existential threat. Singapore maintains advantages in global transshipment (60% of throughput), high-value services, and multi-market distribution that Hainan cannot replicate.
Singapore’s counter-strategy: Pivot to higher-value services (green shipping, digital trade platforms, maritime arbitration), focus on non-China trade lanes, and collaborate where beneficial (PSA International has cooperation agreements with Hainan ports).
The 30% rule allows goods imported to Hainan duty-free to enter mainland China tariff-free if processing adds ≥30% value. Formula: [(Selling Price – Material Costs) ÷ Material Costs] × 100%.
Example: Import $100K electronics components → Hainan assembly/testing adds $45K value (45% added) → Mainland entry of $145K product pays 0% tariff (normally 10-13% = $14.5-18.9K savings).
Key complexity: Value-add calculation must include all material costs (imported + domestic). Companies optimize by importing raw materials rather than semi-finished goods (increases processing value-add) and documenting labor, equipment, overhead carefully. Full compliance requirements detailed by China Briefing.
Industries best positioned: Biopharmaceuticals (API processing 40-60% value-add), electronics assembly (35-50%), luxury customization (40-70%), specialty materials refining (30-45%). Note: Blog 3 in this series provides detailed implementation guide with ROI calculations.
Dubai’s 0% corporate tax (vs. Hainan 15%, Singapore 17%) is powerful for EMEA-focused operations, but less relevant for Asia-Pacific trade optimization. Tax savings matter, but market access and connectivity matter more.
Key distinction: Dubai optimizes for EMEA markets (Middle East, Africa, South Asia), while Hainan optimizes for China market access. They serve different customer bases and trade lanes with minimal overlap (~5%).
Verdict: Complementary, not competitive. Dubai for EMEA gateway, Hainan for China gateway. The 15,000+ Chinese companies registered in Dubai free zones (40% increase 2024-2025) demonstrate this complementarity—Chinese firms use Dubai to access Middle East markets while Dubai firms use Hainan to access China.
Operational risks: (1) Infrastructure learning curve—Hainan targeting <1 hour customs clearance vs. Singapore’s proven 10-minute average. Early 2026 reports show some 3-6 hour delays during teething issues. (2) Service ecosystem gaps—Singapore’s ship repair, marine insurance, commodity trading not yet replicated in Hainan. (3) Skilled labor shortage—Multilingual trade professionals scarce vs. mature Singapore talent pool.
Regulatory risks: (1) Policy consistency—Will 30% threshold remain stable long-term? (2) Compliance complexity—Transfer pricing scrutiny, documentation requirements, audit risks. (3) WTO challenges—Small probability that 30% rule faces trade dispute (though China structures carefully within WTO flexibility).
Geopolitical risks: (1) US-China tensions—Sanctions risk, technology transfer concerns. (2) Taiwan contingency—Hainan’s proximity to potential conflict zone creates military risk. (3) Perception issues—Some Western clients prefer “Singapore handled” for trust reasons.
Mitigation: Test with pilot shipments (5-10% of volume), maintain Singapore backup capacity, use experienced customs brokers, partner with Haikou Customs for pre-approval consultations. Detailed risk management framework in Blog 3 of this series.
No—binary thinking is strategically flawed. The data supports a portfolio approach using multiple hubs optimized for different functions:
Recommended strategy:
- Hainan: China-destined cargo where 30% rule applies (leverage tariff savings)
- Singapore: Global distribution, high-value cargo, multi-market operations (leverage connectivity and trust)
- Dubai: MENA/Africa markets if relevant (leverage geographic/cultural positioning)
Real-world example: Electronics manufacturer allocates:
- 60% through Hainan for mainland China sales (captures 30% rule savings)
- 30% through Singapore for ASEAN/Australia distribution (neutral hub advantage)
- 10% through Dubai for Middle East expansion (EMEA gateway)
Total cost optimized, risk diversified, capabilities matched to market requirements.
As industry analysis notes: “The question isn’t which hub to choose, but how to strategically deploy across multiple hubs to optimize for market access, cost, and resilience simultaneously.”
Action item: Conduct cost-benefit analysis comparing single-hub vs. multi-hub strategy for your specific product portfolio and target markets. Most companies with >$50M in Asia-Pacific revenue find multi-hub strategies optimal.